A hospital administrator monitors the rate of post-surgical infections to ensure that the rate of infection remains low over time. Hospital staff record the date of each post-surgical infection.
The administrator creates a G chart to monitor the rate of infections.
- Open the sample data, PostSurgicalInfections.MWX.
- Choose .
- From Form of data, choose Dates of events.
- In Variables, enter Date of infection.
- Click OK.
Interpret the results
The event probability is 0.099. The event probability is the chance of an event occurring on any given day. For the infection data, the chance of an infection occurring on a given day is 9.9%. Two points failed the Benneyan test (3 points in a row are equal to 0), which indicates that 3 or more infections were recorded on the same day.
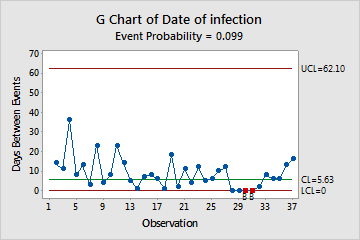
G Chart of Date of infection
Test Results for G Chart of Date of infection
Benneyan Test. 3 points in a row equal to 0.
Test Failed at points: 30, 31
* WARNING * If graph is updated with new data, the results above may no longer
be correct.