Use P Chart to monitor the proportion of defective items where each item can be classified into one of two categories, such as pass or fail. Use this control chart to monitor process stability over time so that you can identify and correct instabilities in a process.
For example, a delivery service manager uses a P chart to monitor the proportion of delivery vehicles that are out of service each day for 2 months. A vehicle that is out of service is considered a defective item.
The chart shows that, on average, 8% of the delivery vehicles are out of service on any particular day. The proportion of defective units for day 19 is out of control. The manager should identify any special causes that contribute to the unusually high rate of defectives. 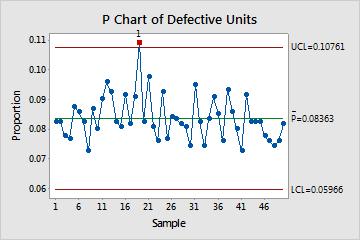
Where to find this control chart
To create a P chart, choose .
When to use an alternate control chart
- If you can count the number of defects on each item, use U Chart, Laney U' Chart, or C Chart to plot the number of defects per unit.
- If your data exhibit overdispersion or underdispersion, Laney P' Chart may more accurately distinguish between common-cause variation and special-cause variation. Overdispersion can cause a traditional P chart to show an increased number of points outside the control limits. Underdispersion can cause a traditional P chart to show too few points outside of the control limits. The Laney P' chart adjusts for these conditions. You can test your data for overdispersion and underdispersion with P Chart Diagnostic. For more information, go to Overdispersion and underdispersion.
Note
The NP chart also plots defective items. However, whereas the P chart plots the proportion of defective items, the NP chart plots the number of defective items.