Select the method or formula of your choice.
In This Topic
Plotted points
Minitab plots the number of defectives in each subgroup,  .
.
Center line
If you do not specify a historical value for the process proportion ( ), then Minitab uses the average proportion of defectives from your data,
  , to estimate
  :
:

The location of the center line for each subgroup,  , is calculated as follows:

Notation
| Term | Description |
|---|---|
 | size of subgroup  |
 | process proportion |
Control limits
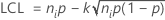
Lower control limit (LCL)
The LCL for each subgroup  is the greater of the following:

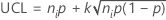
Upper control limit (UCL)
The UCL for each subgroup  is the lesser of the following:

Notation
| Term | Description |
|---|---|
 | size of subgroup  |
 | process proportion |
 | parameter for Test 1. The default is 3. (For more information go to Select tests for special causes for NP Chart.) |