In This Topic
Factor loadings
Factor loadings indicate how much a factor explains a variable. Loadings can range from -1 to 1.
Minitab calculates unrotated factor loadings, and rotated factor loadings if you select a rotation method for the analysis.
Interpretation
Examine the loading pattern to determine the factor that has the most influence on each variable. Loadings close to -1 or 1 indicate that the factor strongly influences the variable. Loadings close to 0 indicate that the factor has a weak influence on the variable. Some variables may have high loadings on multiple factors.
Unrotated factor loadings are often difficult to interpret. Factor rotation simplifies the loading structure, and often makes the factors more clearly distinguishable and easier to interpret. However, one method of rotation may not work best in all cases. You may want to try different rotations and use the one that produces the most interpretable results. You can also sort the rotated loadings to more clearly assess the loadings within a factor.
- Company Fit (0.778), Job Fit (0.844), and Potential (0.645) have large positive loadings on factor 1, so this factor describes employee fit and potential for growth in the company.
- Appearance (0.730), Likeability (0.615), and Self-confidence (0.743) have large positive loadings on factor 2, so this factor describes personal qualities.
- Communication (0.802) and Organization (0.889) have large positive loadings on factor 3, so this factor describes work skills.
- Letter (0.947) and Resume (0.789) have large positive loadings on factor 4, so this factor describes writing skills.
Unrotated Factor Loadings and Communalities
| Variable | Factor1 | Factor2 | Factor3 | Factor4 | Communality |
|---|---|---|---|---|---|
| Academic record | 0.380 | 0.455 | 0.340 | 0.259 | 0.534 |
| Appearance | 0.359 | 0.530 | -0.040 | 0.523 | 0.685 |
| Communication | 0.465 | 0.660 | -0.377 | -0.023 | 0.795 |
| Company Fit | 0.523 | 0.677 | 0.266 | -0.253 | 0.866 |
| Experience | 0.508 | 0.194 | 0.450 | 0.232 | 0.553 |
| Job Fit | 0.532 | 0.632 | 0.415 | -0.201 | 0.895 |
| Letter | 0.992 | -0.094 | -0.012 | -0.007 | 0.994 |
| Likeability | 0.412 | 0.529 | 0.032 | 0.377 | 0.593 |
| Organization | 0.406 | 0.761 | -0.424 | -0.055 | 0.926 |
| Potential | 0.446 | 0.548 | 0.431 | 0.172 | 0.714 |
| Resume | 0.850 | 0.040 | 0.096 | 0.283 | 0.814 |
| Self-Confidence | 0.293 | 0.575 | 0.083 | 0.506 | 0.679 |
| Variance | 3.6320 | 3.3193 | 1.0883 | 1.0095 | 9.0491 |
| % Var | 0.303 | 0.277 | 0.091 | 0.084 | 0.754 |
Rotated Factor Loadings and Communalities
| Variable | Factor1 | Factor2 | Factor3 | Factor4 | Communality |
|---|---|---|---|---|---|
| Academic record | 0.481 | 0.510 | 0.086 | 0.188 | 0.534 |
| Appearance | 0.140 | 0.730 | 0.319 | 0.175 | 0.685 |
| Communication | 0.203 | 0.280 | 0.802 | 0.181 | 0.795 |
| Company Fit | 0.778 | 0.165 | 0.445 | 0.189 | 0.866 |
| Experience | 0.472 | 0.395 | -0.112 | 0.401 | 0.553 |
| Job Fit | 0.844 | 0.209 | 0.305 | 0.215 | 0.895 |
| Letter | 0.219 | 0.052 | 0.217 | 0.947 | 0.994 |
| Likeability | 0.261 | 0.615 | 0.321 | 0.208 | 0.593 |
| Organization | 0.217 | 0.285 | 0.889 | 0.086 | 0.926 |
| Potential | 0.645 | 0.492 | 0.121 | 0.202 | 0.714 |
| Resume | 0.214 | 0.365 | 0.113 | 0.789 | 0.814 |
| Self-Confidence | 0.239 | 0.743 | 0.249 | 0.092 | 0.679 |
| Variance | 2.5153 | 2.4880 | 2.0863 | 1.9594 | 9.0491 |
| % Var | 0.210 | 0.207 | 0.174 | 0.163 | 0.754 |
Communality
The communality is each variable's proportion of variability that is explained by the factors. The communality value is the same, regardless of whether you use unrotated factor loadings or rotated factor loadings for the analysis.
Interpretation
Examine the communality values to assess how well each variable is explained by the factors. The closer the communality is to 1, the better the variable is explained by the factors. You can decide to add a factor if the factor contributes significantly to the fit of certain variables.
Unrotated Factor Loadings and Communalities
| Variable | Factor1 | Factor2 | Factor3 | Factor4 | Communality |
|---|---|---|---|---|---|
| Academic record | 0.380 | 0.455 | 0.340 | 0.259 | 0.534 |
| Appearance | 0.359 | 0.530 | -0.040 | 0.523 | 0.685 |
| Communication | 0.465 | 0.660 | -0.377 | -0.023 | 0.795 |
| Company Fit | 0.523 | 0.677 | 0.266 | -0.253 | 0.866 |
| Experience | 0.508 | 0.194 | 0.450 | 0.232 | 0.553 |
| Job Fit | 0.532 | 0.632 | 0.415 | -0.201 | 0.895 |
| Letter | 0.992 | -0.094 | -0.012 | -0.007 | 0.994 |
| Likeability | 0.412 | 0.529 | 0.032 | 0.377 | 0.593 |
| Organization | 0.406 | 0.761 | -0.424 | -0.055 | 0.926 |
| Potential | 0.446 | 0.548 | 0.431 | 0.172 | 0.714 |
| Resume | 0.850 | 0.040 | 0.096 | 0.283 | 0.814 |
| Self-Confidence | 0.293 | 0.575 | 0.083 | 0.506 | 0.679 |
| Variance | 3.6320 | 3.3193 | 1.0883 | 1.0095 | 9.0491 |
| % Var | 0.303 | 0.277 | 0.091 | 0.084 | 0.754 |
In these results, 4 factors were extracted from the 12 variables. They communality values are generally high for all the variables, which indicates that variables are well represented by the 4 factors. For example, 0.895, or 89.5%, of the variability in Job Fit is explained by the 4 factors.
Variance
The variability in the data explained by each factor. If you use the principal components method of extraction and do not rotate the loadings, the variance of each factor equals its eigenvalue. Rotation changes the distribution of the proportion of variation explained by each factor, although the total variation explained by all factors remains the same.
Interpretation
Examine the variance for each factor. The higher the variance, the more that the factor explains the variability in the data. If you do not know how many factors to extract in the analysis, you can first use the principal components method of extraction, without rotation, using the default number of factors (which extracts the maximum number of factors) as a preliminary assessment. Then define the important factors as those with a variance (eigenvalue) greater than a certain value. For example, one criteria is to include any factors with an eigenvalue of at least 1. Another method is to visually evaluate the eigenvalues on the scree plot to determine at what point the eigenvalues show little change and approach 0. For more information, see the topic on the Scree plot.
Unrotated Factor Loadings and Communalities
| Variable | Factor1 | Factor2 | Factor3 | Factor4 | Factor5 | Factor6 | Factor7 | Factor8 |
|---|---|---|---|---|---|---|---|---|
| Academic record | 0.726 | 0.336 | -0.326 | 0.104 | -0.354 | -0.099 | 0.233 | 0.147 |
| Appearance | 0.719 | -0.271 | -0.163 | -0.400 | -0.148 | -0.362 | -0.195 | -0.151 |
| Communication | 0.712 | -0.446 | 0.255 | 0.229 | -0.319 | 0.119 | 0.032 | 0.088 |
| Company Fit | 0.802 | -0.060 | 0.048 | 0.428 | 0.306 | -0.137 | -0.067 | 0.105 |
| Experience | 0.644 | 0.605 | -0.182 | -0.037 | -0.092 | 0.317 | -0.209 | -0.102 |
| Job Fit | 0.813 | 0.078 | -0.029 | 0.365 | 0.368 | -0.067 | -0.025 | -0.032 |
| Letter | 0.625 | 0.327 | 0.654 | -0.134 | 0.031 | 0.025 | 0.017 | -0.113 |
| Likeability | 0.739 | -0.295 | -0.117 | -0.346 | 0.249 | 0.140 | 0.353 | -0.142 |
| Organization | 0.706 | -0.540 | 0.140 | 0.247 | -0.217 | 0.136 | -0.080 | -0.105 |
| Potential | 0.814 | 0.290 | -0.326 | 0.167 | -0.068 | -0.073 | 0.048 | -0.112 |
| Resume | 0.709 | 0.298 | 0.465 | -0.343 | -0.022 | -0.107 | 0.024 | 0.170 |
| Self-Confidence | 0.719 | -0.262 | -0.294 | -0.409 | 0.175 | 0.179 | -0.159 | 0.230 |
| Variance | 6.3876 | 1.4885 | 1.1045 | 1.0516 | 0.6325 | 0.3670 | 0.3016 | 0.2129 |
| % Var | 0.532 | 0.124 | 0.092 | 0.088 | 0.053 | 0.031 | 0.025 | 0.018 |
| Variable | Factor9 | Factor10 | Factor11 | Factor12 | Communality |
|---|---|---|---|---|---|
| Academic record | 0.097 | -0.142 | -0.026 | -0.031 | 1.000 |
| Appearance | 0.082 | 0.016 | 0.020 | -0.038 | 1.000 |
| Communication | 0.023 | 0.204 | 0.012 | -0.100 | 1.000 |
| Company Fit | -0.019 | -0.067 | 0.188 | -0.021 | 1.000 |
| Experience | 0.121 | 0.039 | 0.077 | 0.009 | 1.000 |
| Job Fit | 0.146 | 0.066 | -0.176 | 0.008 | 1.000 |
| Letter | -0.079 | -0.130 | -0.043 | -0.127 | 1.000 |
| Likeability | 0.051 | 0.022 | 0.064 | 0.012 | 1.000 |
| Organization | -0.020 | -0.162 | -0.032 | 0.136 | 1.000 |
| Potential | -0.290 | 0.100 | -0.023 | 0.028 | 1.000 |
| Resume | 0.008 | 0.090 | 0.010 | 0.156 | 1.000 |
| Self-Confidence | -0.098 | -0.061 | -0.065 | -0.047 | 1.000 |
| Variance | 0.1557 | 0.1379 | 0.0851 | 0.0750 | 12.0000 |
| % Var | 0.013 | 0.011 | 0.007 | 0.006 | 1.000 |
This analysis was performed using principal components method and the default settings (no rotation). The first four factors have variance (eigenvalues) greater than 1. The eigenvalues change less markedly when more than 6 factors are used. Therefore, 4 factors explain most of the variability in the data. Based on these preliminary results, repeat the factor analysis and extract only 4 factors, and experiment with different rotations.
% Var
The percentage of variance (% Var) is the proportion of variability in the data explained by each factor. The values of % Var can range from 0 (0%) to 1 (100%).
Interpretation
Examine the % Var value for each factor. Higher values of % Var indicate that a factor explains more of the variability. Therefore, you can use the % Var values to determine which factors are most important.
The communality value for % Var indicates the total variation explained by all the factors in the analysis. Use this value to help determine whether the number of factors used in the analysis explains a sufficient amount of total variation in the data.
Unrotated Factor Loadings and Communalities
| Variable | Factor1 | Factor2 | Factor3 | Factor4 | Communality |
|---|---|---|---|---|---|
| Academic record | 0.380 | 0.455 | 0.340 | 0.259 | 0.534 |
| Appearance | 0.359 | 0.530 | -0.040 | 0.523 | 0.685 |
| Communication | 0.465 | 0.660 | -0.377 | -0.023 | 0.795 |
| Company Fit | 0.523 | 0.677 | 0.266 | -0.253 | 0.866 |
| Experience | 0.508 | 0.194 | 0.450 | 0.232 | 0.553 |
| Job Fit | 0.532 | 0.632 | 0.415 | -0.201 | 0.895 |
| Letter | 0.992 | -0.094 | -0.012 | -0.007 | 0.994 |
| Likeability | 0.412 | 0.529 | 0.032 | 0.377 | 0.593 |
| Organization | 0.406 | 0.761 | -0.424 | -0.055 | 0.926 |
| Potential | 0.446 | 0.548 | 0.431 | 0.172 | 0.714 |
| Resume | 0.850 | 0.040 | 0.096 | 0.283 | 0.814 |
| Self-Confidence | 0.293 | 0.575 | 0.083 | 0.506 | 0.679 |
| Variance | 3.6320 | 3.3193 | 1.0883 | 1.0095 | 9.0491 |
| % Var | 0.303 | 0.277 | 0.091 | 0.084 | 0.754 |
In these results, 0.303, or 30.3%, of the variability in the data is explained by Factor 1. All four factors together explain 0.754, or 75.4%, or the variability in the data.
Factor score coefficients
Factor coefficients identify the relative weight of each variable in the component in a factor analysis. The larger the absolute value of the coefficient, the more important the corresponding variable is in calculating the component. Minitab uses the factor coefficients to calculate the factor scores, which are the estimated values of the factors. Minitab calculates factor scores by multiplying factor score coefficients (listed under Factor 1, Factor 2, and so on) and your data after they have been scaled and centered by subtracting means.
Interpretation
- Examine the behavior of observations.
- Use in another analysis such as regression or MANOVA.
Note
You must standardize the variables to use the estimated coefficients to calculate the factor scores.
Scree plot
The scree plot displays the number of the factor versus its corresponding eigenvalue. The scree plot orders the eigenvalues from largest to smallest. When no rotation is done, the eigenvalues of the correlation matrix equal the variances of the factors.
To display the scree plot, you must click Graphs and select the scree plot when you perform the analysis.
Interpretation
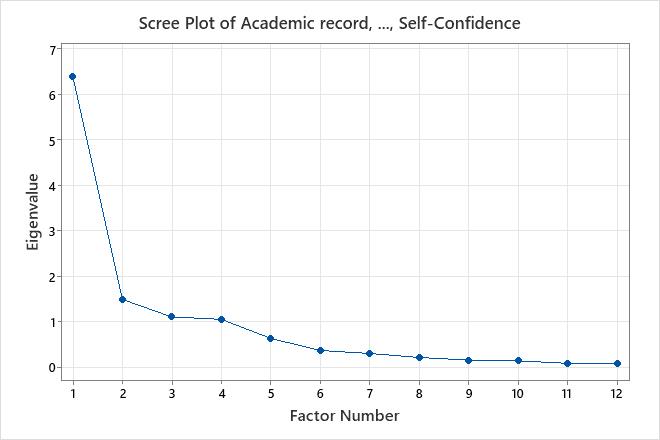
This scree plot shows that the first four factors account for most of the total variability in data (given by the eigenvalues). The eigenvalues for the first four factors are all greater than 1. The remaining factors account for a very small proportion of the variability and are likely unimportant.
Score plot
The score plot graphs the scores of the second factor versus the scores of the first factor.
To display the score plot, you must click Graphs and select the score plot when you perform the analysis.
Interpretation
If the first two factors account for most of the variance in the data, you can use the score plot to assess the data structure and detect clusters, outliers, and trends. Groupings of data on the plot may indicate two or more separate distributions in the data. If the data follow a normal distribution and no outliers are present, the points are randomly distributed about the value of 0.
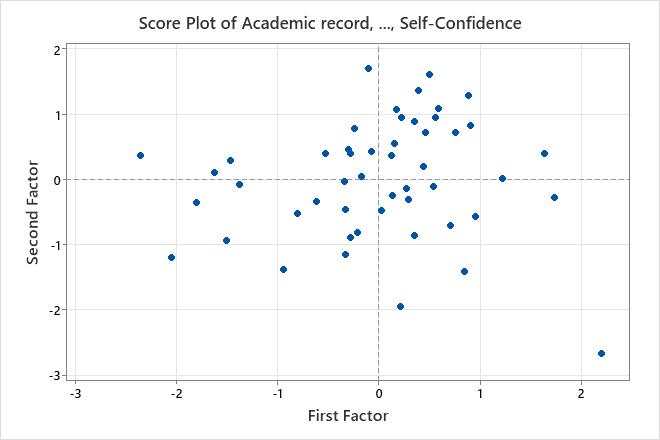
In this score plot, the data appear normal and no extreme outliers are apparent. However, you may want to investigate the data value shown in the lower right of the plot, which lies farther away from the other data values.
Tip
To see the calculated score for each observation, hold your pointer over a data point on the graph. To create score plots for other factors, store the scores and use .
Loading plot
The loading plot graphs the rotated factor loadings of each variable for the first factor versus the rotated factor loadings for the second factor.
To display the loading plot, you must click Graphs and select the loading plot when you perform the analysis.
Interpretation
Use the loading plot to identify which variables have the largest effect on the factors. Loadings can range from -1 to 1. Loadings close to -1 or 1 indicate that the variable strongly influences the factor. Loadings close to 0 indicate that the variable has a weak influence on the factor. Evaluating the loadings can also help you characterize each factor in terms of the variables. After selecting the number of factors, try different rotations so you can more easily interpret the factor loadings.
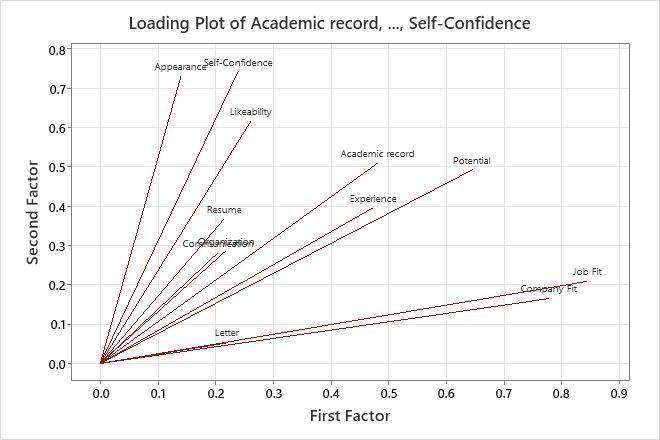
For this loading plot, a varimax rotation was performed on the data, which makes the first two factors easier to interpret. Job Fit and Company Fit have large positive loadings on factor 1, so this factor describes an applicant's suitability for the position. Appearance, Likeability, and Self-confidence have large positive loadings on factor 2, so this factor describes an applicant's personal qualities.
Biplot
The biplot overlays the score plot and the loading plot.
To display the biplot, you must click Graphs and select the biplot when you perform the analysis.
Interpretation
Use the biplot to assess the data structure and the loadings of the first two factors on one graph. Minitab plots the second factor scores versus the first factor scores, as well as the loadings for both factors.
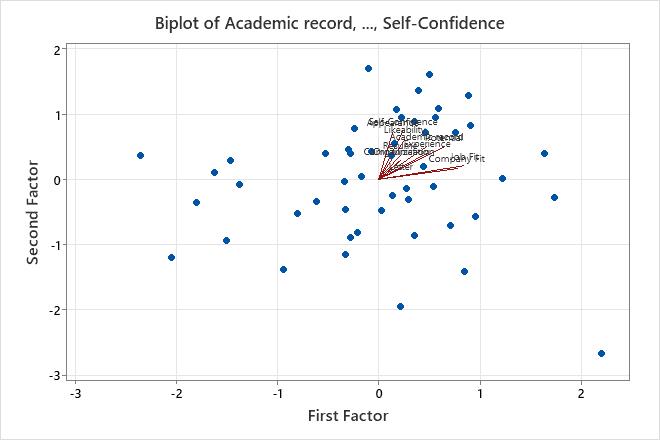
- The data appear normal and no extreme outliers are apparent. However, you may want to investigate the data value shown in the lower right of the plot, which lies farther away from the other data values.
- Job Fit and Company Fit have large positive loadings on factor 1, so this factor describes an applicant's suitability for the position.
- Appearance, Likeability, and Self-confidence have large positive loadings on factor 2, so this factor describes an applicant's personal qualities.