Prep your data
Objectives
Before analyzing fraud detection trends, the dataset must be cleaned and standardized. In this section, you will:
- Correct data types
- Remove invalid records
- Standardize categorical values
- Organize the dataset for analysis
- Understand how your data flows through the Minitab Data Center
Overview of data pipelines
The Minitab Data Center uses a data pipeline to prepare your data. A pipeline is a sequence of connected steps that transform raw data into a clean, analysis-ready dataset.
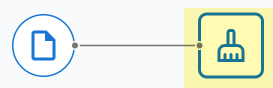
Every Data Center project contains an interactive pipeline diagram that represents the data processing steps. A typical pipeline flow contains the following nodes.
Data Source → Cleanup → Merge/Reshape→ Output
- Data Source: Connect to your data and define its structure.
- Cleanup: Fix, filter, and standardize your data.
- Merge/Reshape: Combine or reorganize datasets.
- Output: Send cleaned data to Minitab Statistical Software or Minitab Dashboards.
Each step appears as a visual node in the pipeline, making it easy to understand and reuse your data preparation process.
Open your data source
- From the Minitab Solution Center Home page, select Data Prep.
- Select Add Data.
- Sign into your repository.
- Open the Insurance Fraud Data.
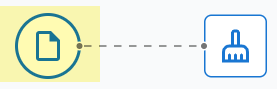
Data Source → Cleanup → Output
Understand the Data Center views
- Cleanup view
-
 Use the Cleanup view to:
- Change data types
- Filter rows
- Replace values
- Sort data
- Standardize categories
- Data Source view
- If you need to change the dataset schema or any settings that affect the
entire dataset, select the data source file icon to open the Options panel.
For more information, go to Manage the dataset schema or Set data source options.
Use the Data Source view to:- Adjust dataset-wide settings
- Modify schema (column names and types)
- Configure file import options
When to use each view:
- Use Cleanup to fix data.
- Use Data Source view to fix dataset structure.
Prepare the dataset
- Open Insurance Fraud Data in the Minitab Data Center.
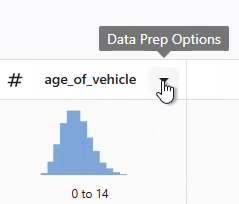
- Make sure you are in the Cleanup view.
- Select the column and open the Data Prep
Options dropdown menu to access the column cleanup options.
1. Standardize identifiers
-
Change claim_number data type from numeric to text.
-
Prepend the # symbol to all claim numbers.
Why this matters: Prevents numeric interpretation and preserves formatting consistency.
2. Remove invalid or unrealistic values
- Filter age_of_driver to include only values ≤ 100.
- Filter annual_income to include only values greater than 1.
Why this matters: Removes unrealistic ages and invalid income entries that could skew results.
3. Standardize categorical values
- In gender, replace:
- M → male
- F → female
- Change address_change data type from numeric to text.
- In address_change, replace:
- 1 → yes
- 0 → no
Why this matters: Standardized categories improve readability, grouping, and reporting.
4. Correct data types
- Change zip_code data type from numeric to text.
Why this matters: Preserves leading zeros and prevents unintended numeric operations.
5. Organize the dataset
- fraud reported
- injury_claim
- zip_code
Why this matters: Sorting helps prioritize and review fraud-related records efficiently.
Merging or reshaping datasets
In addition to cleaning and standardizing data, you may need to combine or reorganize datasets before analysis.
- Join
- Combines related datasets by matching rows using one or more key fields.
This adds columns and makes the dataset wider.
For more information, go to Join datasets.
- Union
- Stacks datasets with the same structure into one dataset. This adds rows
and makes the dataset longer.
For more information, go to Union datasets.
- Transpose
- Switches rows and columns. This is useful when data is arranged in a
format that is not ideal for analysis.
For more information, go to Transpose datasets.
Use Minitab AI to clean your data
The Minitab Data Center provides a conversational interface that guides your data preparation in the Cleanup view.
For the example above, you can enter the following text into the Minitab AI prompt to get the same results as individual steps.
Make claim numbers to text. Add the number symbol to claim numbers. Remove drivers that are older than one hundred. Change m to male and f to female. Remove drivers that don’t have a valid income. Change address_change to text. Make 1 to yes and 0 to no for address changes. Sort by fraud, injury claim, and zip code.
For more information on using Minitab AI in the Data Center, go to Using Minitab AI to clean your data.
Reuse your data prep steps
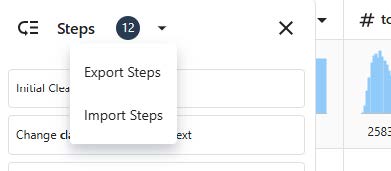
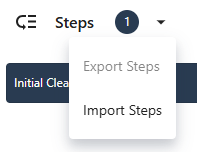
- Export data prep steps
- To save the steps, export them as a .mdcs file.
- In the Steps pane on the left, select Export Steps from the dropdown menu.
- The file is saved to your downloads folder or other save location and uses the same name as your data file. Change the name accordingly.
- In the Steps pane on the left, select Export Steps from the dropdown menu.
- Import data prep steps
- To apply the steps to a new data file, import them as a .mdcs file.
Select Import Steps from the dropdown menu in the Steps pane.
Explore data summaries
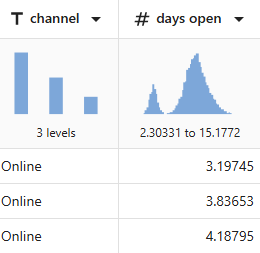
For example, channel has 3 levels and days open shows a bimodal distribution.
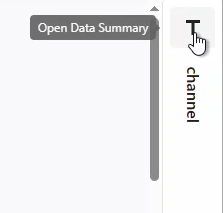
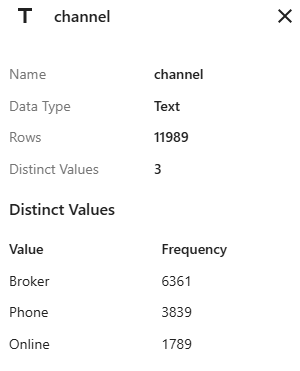
The data summary for channel shows the frequency for each of the 3 levels.
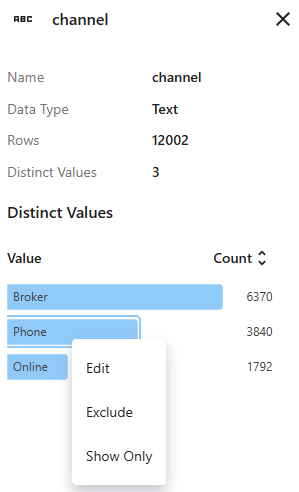
Use the right-click menu to edit the grouping label, exclude the group from the dataset, or show only the rows that contain this value.
What's next
Because the data for days open indicate two distributions, the insurance company wants to look at this further. Go to Analyze your data.