Create a dashboard
Add data to your dashboard
This example uses the prepped dataset from the Prep your data. You can alternatively open a dataset directly in the dashboard but clean up steps will not be available.
Important
Each data connection can live in only one dashboard or project. Because you opened the previous dataset in Minitab Statistical Software, you need to open a second instance of the same dataset to use it in Minitab Dashboards.
- From the Minitab Solution Center
Home
 page, select Data Prep.
 - Select Add Data and open Insurance Fraud Data.
- Select Import Steps from the dropdown menu in the Steps
 pane on the
left. Then browse to the steps that you exported in the Prep your data topic.
pane on the
left. Then browse to the steps that you exported in the Prep your data topic. - Select .
- Select the drop down at the top of the page and enter Insurance Fraud Dashboard in File Name.
Create assets for your dashboard
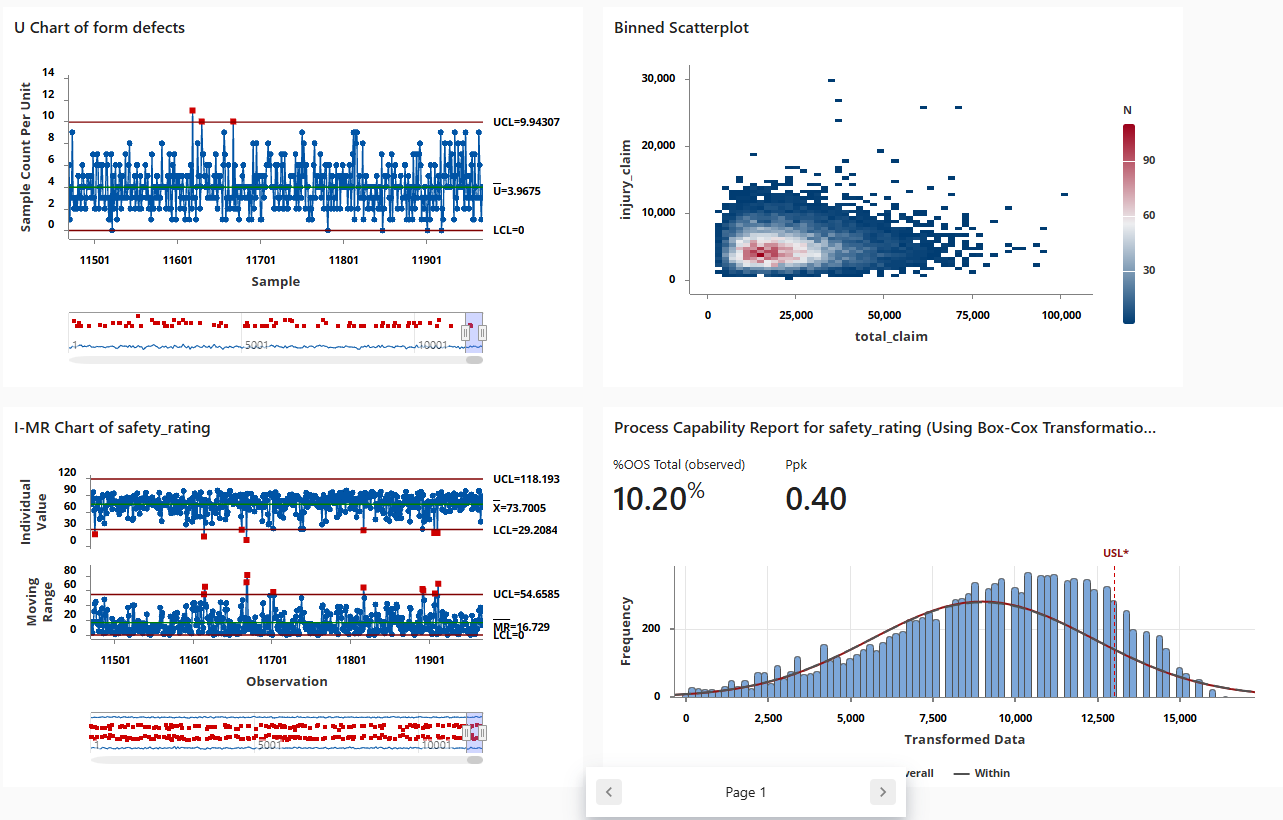
Complete the following steps to create a dashboard to quickly monitor key metrics.
- From the left pane, open Assets.
- Under Process Quality, select U Chart.
- Ensure the insurance fraud dataset is selected and select Open.
- In Variable, enter form defects.
- In Subgroup size, enter 1.
- Select OK.
- Under Process Quality, select Normal Capability.
- Ensure the insurance fraud dataset is selected and select Open.
- In Data column, enter safety_rating.
- In Subgroup size, enter 1.
- In Upper spec, enter 90.
- Select Transform. Select Box-Cox power transformation (W = Y^λ).
- Select OK in each dialog.
If you want, add other assets to your dashboard.
Create assets with Minitab AI
Minitab Dashboards provides artificial intelligence that creates visualizations and places them on the dashboard. This can give you a good starting point to create an informative dashboard. You can edit and delete these visualizations after Minitab AI creates them.
Note
AI technology may make mistakes. It is the user's responsibility to ensure the output is accurate, appropriate, and meets your organization's standards and requirements. For more information, see the Minitab Trust Center.
Rearrange assets
You can arrange the assets on the dashboard canvas to find the best way to display your visualizations. Your dashboard can include multiple pages.
Sync data after a new data prep step
In the previous step, we created a dashboard with a data connection to monitor key metrics. The improvement team decided that some of the safety ratings may be incorrect, so they want to apply a filter to remove safety ratings that are less than 25.
- Select Data
 from the left pane. From the Data Connections pane, select Edit to add the data prep step in the Data Center.
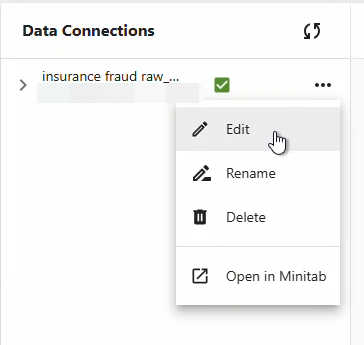
- From dropdown menu for the safety_rating column, select Filter Rows. Then enter safety_rating, greater than or equal to, 25 and select OK.
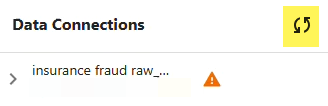
- Refresh the data connection to save the changes. You can refresh from the
Minitab Data Center or from the Dashboard.
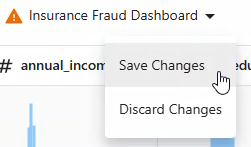
- From the Data Center, use the dropdown menu and select
Save Changes to refresh the data connection.
- From the Dashboard, Select the Refresh icon to refresh the data connection.
- From the Data Center, use the dropdown menu and select
Save Changes to refresh the data connection.