Define the model
To run a simulation, you must know the distribution and parameters for each input (X) and the equations that describe your process.
Choose a distribution
- If historical data is available and represents expected future performance, you can use the Use data to decide feature. Engage automatically finds the distribution with the best fit.
- If historical data is not available, seek out experts in your organization or consult the literature. Be sure to look for industry-specific examples that match your application.
Identify the equations
Equations can come from process knowledge or be based on a model that you created from a designed experiment (DOE) or regression analysis in Minitab.
Import models from Minitab
| Model | Exceptions |
|---|---|
| Factorial |
|
| Response Surface |
|
| Regression |
|
- X variables (inputs), which can include continuous factors, categorical factors, and covariates
- Y variables (outputs)
- The Y equation, along with the inputs' coefficients in uncoded units and the constant term
If a model contains categorical factors, you can select the factor levels to include in the equation.
Note
To compare the simulation results for the same Y variable using different factor levels, select the Y variable and the factor level to include in the equation, then import them. Repeat this process until you have selected all the factor levels to compare.
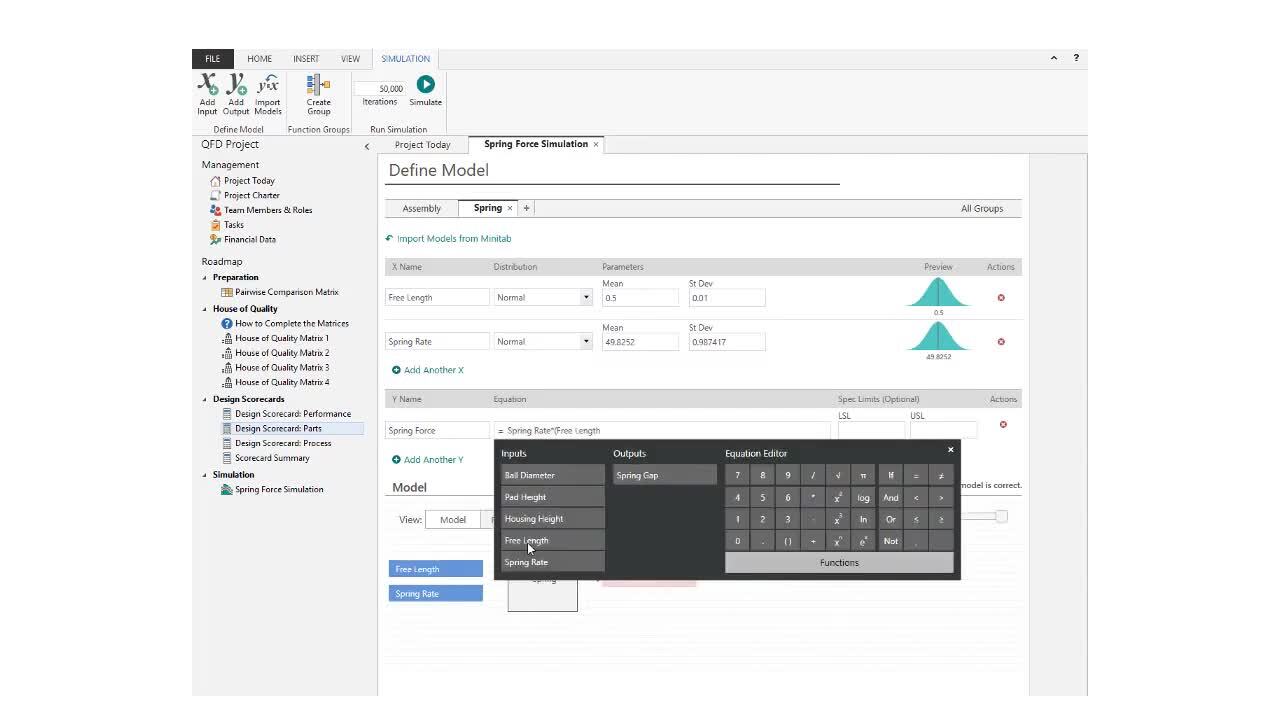
Run the simulation
After you define the model, you are ready to run a simulation.
- From the navigator pane, select Add Tool, then select .
- Select Import Models from Minitab if you want to use a model from Minitab. You can choose a Minitab project that you added as a related document or one that you saved to your computer or a network. For more information, go to "Import models from Minitab", in this topic.
- Enter a name for each input. If you imported a model from Minitab, you can change the name of the imported input.
- Choose a distribution for each input, then enter the parameters. If you are not sure which distribution to choose and you have historical data from the system, select Use data to decide. Then, browse to the CSV file that contains data. Be sure that the data represents expected future performance. Engage automatically finds the distribution with the best fit. For more information, go to "Choose a distribution" in this topic.
- Enter a name for each output. If you imported a model from Minitab, you can change the name of the imported output variable.
- Enter the equation. Use the Equation Editor if necessary. For more information, go to Use the Equation Editor in simulations.
- Enter a lower specification limit, an upper specification limit, or both. To obtain process performance metrics, you must enter at least one specification limit. For more information, go to "Cpk and Ppk calculations in simulations", in this topic.
-
Use the diagram to verify your model.
- On the Simulation menu, enter the number of iterations. The number of iterations should adequately cover the range of possible input and output values, and provide accurate results. The maximum number is 1,000,000. However, the default of 50,000 is sufficient for most models.
- Choose .
Create groups
When you have a complex or a large simulation, you can create groups to define the model by function. For example, you might want to describe different actions or various parts' behavior within the simulation. With groups, you can categorize inputs and outputs to help you manage and organize your simulation.
- After you add a simulation, choose . A new tab appears above the X variables.
- To rename this group, double-click the tab and enter a name.
-
To add another group, select the plus sign icon
 beside the new group.
If you accidentally close a group, press
Ctrl+z
to undo the action.
beside the new group.
If you accidentally close a group, press
Ctrl+z
to undo the action.
- Enter new inputs and outputs for each group. If an input or an output is used in more than one group, you only need to enter it once.
- Enter the output equation for each group. Inputs and outputs from all groups are available in the Equation Editor.
-
Use the diagram to verify the model, by model or function, for each
group or for all groups.
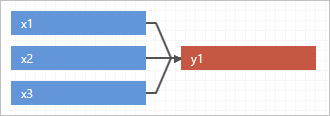
To view all groups, select All Groups above the distribution previews.The following example shows all groups by model.
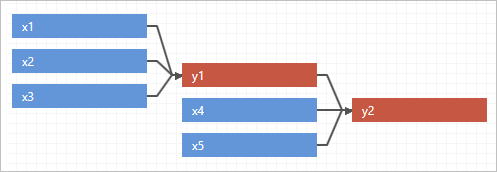 The following example shows all groups by function.
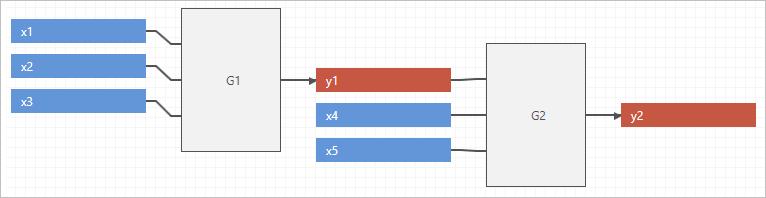
Cpk and Ppk calculations in simulations
Often, in Monte Carlo simulations, the simulated responses violate the assumption of normality. Therefore, Engage uses a nonparametric method to calculate capability in the simulation tool. The nonparametric method calculates the spread of the output distribution using the observed 0.135 and 99.865 percentiles of the simulated data, which is analogous to +/-3 sigma in a normal distribution.
Because there are no subgroups and no concept of long term and short term variation in the simulation context, Cpk and Ppk values are equivalent in the Engage Monte Carlo simulation. Choose , then select the label you prefer.
Based on the spread in the data and the specification limits you set in the model, Engage calculates PPL and PPU to find the corresponding Ppk.
- PPL=(Median–LSL)/(Median–0.135th Percentile)
- PPU=(USL–Median)/(99.865th Percentile–Median)
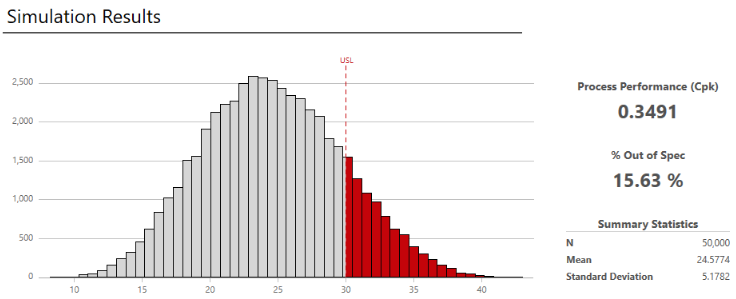
Examine the results
Engage displays the results of the simulation, how your results compare to generally accepted values, and guidance for next steps.
-
View the results in the workspace.
You can switch between the model view and the results view of the
simulation.
Note
Each time you repeat the simulation, the results will vary because the simulation is based on randomly selected values for the inputs.
-
Evaluate the results, and perform any of the following tasks.
- To view DPMO (Defects Per Million Opportunities), observed performance, summary statistics, percentiles, and model assumptions, select More Results.
- To view
information about next steps, hold the pointer on
 .
.
- To add or change the specification limits, choose . The graph and the results are updated using the new limits.
- To copy the results so that you can paste them into Microsoft® PowerPoint presentations, right-click the workspace, then choose Copy.
- To assess the stability of the estimates, rerun the simulation with different numbers of iterations.
-
Consider additional simulations.
- Identify optimal settings for the inputs you can control. For more information, go to Perform a parameter optimization.
- Demonstrate how changes to the variability of the inputs affect the variability of the outputs. For more information, go to Perform a sensitivity analysis.
Edit the model
After you analyze the results, you may want to return to the model and change inputs or outputs, then rerun it. This lets you test several possible scenarios so that you can get insight into the behavior of your system and make better decisions.
-
Choose one of the following options.
- To change the model, choose . By default, Engage overwrites the existing values in the current model.
- To preserve the current settings and work in a copy, choose .
- Choose .
Watch a video
Watch a video to learn more about Monte Carlo simulations.