In This Topic
Control chart options
Specify the control chart settings including estimation methods, control chart tests, and other analysis settings.
Parameters
Enter the historical values for the parameters to calculate the center line and control limits. If you do not enter values, Minitab Connect estimates the mean and the standard deviation from the data. If you enter only one value, Minitab Connect estimates the other parameter from the data.
- Historical mean
- If you know the historical mean of your process, or if you have an estimate obtained from past data, enter the value to use in the analysis.
- Historical standard deviation
- If you know the historical standard deviation of your process, or if you have an estimate
obtained from past data, enter the value to use in the analysis.
You can also specify the Historical standard deviation within subgroups and the Historical standard deviation between subgroups for an I-MR-R/S chart.
If you want to specify the method that Minitab uses to estimate the standard deviation from your sample data, specify the methods for the Estimation.
- Historical proportion
- If you know the historical proportion of your process, or if you have an estimate obtained from past data, enter the value to use in the analysis.
For more information on using historical parameters to set the center line and control limits, go to Common tasks using the SPC tool and select Use historical parameters to calculate the center line and control limits.
Estimation
- Parameter estimation
- If some subgroups have erratic data because of special causes that
you have corrected, you can omit these subgroups from the calculations to avoid
incorrect parameter estimates.
From the dropdown list, specify whether you want to use all the subgroups, list the subgroups to omit, or list the subgroups to include.
Note
Use a colon to indicate a range of subgroups. Leave a space between each subgroup or range of subgroups. For example, to specify subgroups 2, 9, 44, 45, 46, and 47, enter 2 9 44:47.
- Estimation method for standard deviation
- The available methods depend on the type of control chart and the
subgroup size.
- Pooled standard deviation: The pooled standard deviation is the weighted average of subgroup variances, which gives larger subgroups more influence on the overall estimate. This method provides the most precise estimate of standard deviation when the process is in control.
- Rbar: Rbar is the average of the subgroup ranges. This method is a common estimate of the standard deviation and works best with subgroup sizes from 2 to 8.
- Sbar: Sbar is the average of the subgroup standard deviations. This method provides a more precise estimate of the standard deviation than Rbar, especially with subgroup sizes > 8.
- Average moving range: The average moving range is the average value of the moving range of two or more consecutive points. This method is commonly used when the subgroup size is 1.
- Median moving range: The median moving range is the median value of the moving range of two or more consecutive points. This method is best to use when data have extreme ranges that could influence the moving range.
- Length of moving range
- Enter the number of observations used to calculate the moving range. The length must be ≤ 100. The default length is 2 because consecutive values have the greatest chance of being alike.
- Use Nelson estimate
- Select this option to correct for unusually large moving range values in the calculation of the control limits.
- Use unbiasing constants
- Unbiasing constants reduce the bias that can occur when a parameter is estimated from a small number of observations. As the number of observations increases, unbiasing constants have less effect on the calculated results.
Control Limits
- Force straight control limits for unequal subgroup sizes
- By default, Minitab Connect calculates the control limits using the actual subgroup sizes.
When the subgroup sizes differ, the control limits are uneven, but
you can force the control limits to be straight. This option is especially useful when all subgroups were intended to be the same size, but some subgroups are a different size. For example, some subgroups are smaller because of missed measurements.
Note
Use this option only if the differences between the subgroup sizes are small. Don't use this option when the difference between subgroup sizes is more than 25%. For example, if the largest subgroup has 10 observations and the smallest subgroup has 8 observations, then the difference is 20% ((10 - 8) / 10 = 0.2 = 20%).
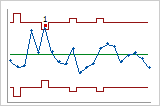
Tests
- Tests for Special Causes
-
Minitab Connect provides eight tests for special causes for variables control
charts and four tests for special causes for attributes control
charts.
Use the tests to determine which observations to investigate, and to identify the specific patterns and trends in your data. By default, Minitab Connect uses only Test 1. Select additional tests based on company or industry standards.
For more information on changing the test defaults, go to Customize tests for special causes.
- Point label options
- Check Test failure label to display the test number of a failed test.
Check Marked point label to display the label of a marked point.
Scale
- X-scale
- Specify a time scale for the x-axis.
- Index: Label the x-axis with the number of the subgroup.
- Stamp: Label the x-axis with values from a field.
More options
- Calculation Method
- Specify which data points to use for the calculation of the center
line and control limits.
- Auto (Calculated): Use all the data points to calculate the center line and control limits.
- Subset (View): Use a subset of the data points to calculate the center
line and control limits. Choose the saved view.
Note
Views are created and saved in the Prep tool
 . For
more information, go to Create a custom data view.
. For
more information, go to Create a custom data view.
For more information on using a subset of data to set the center line and control limits, go to Use a subset of data to calculate the center line and control limits.
- Use last subgroups to display
- Enter a value to specify the most recent number of subgroups to display. For example, if you enter 100, the chart displays the last 100 subgroups.
- Series 1 Plot Lines, Series 2 Plot Lines, and Series 3 Plot Lines
- The series lines are the center line and control limits for each control chart. A single
chart, such as a P Chart, includes one series. Two control charts, such as Xbar-R, include two series. The I-MR-R/S chart includes three series.
You can change the line colors and styles for each line.
- Add Plot Line
- Specify to add another line, such as an action limit.
When a plotted point goes beyond this line and
Marked point label is checked, the point has the name of the line as a
label.
For more information on adding reference lines and marked points, go to Add reference line and marked points.
Capability analysis options
Specify the capability analysis settings including estimation methods, preferred capability statistics, and other analysis settings.
Parameters
- Historical mean
- If you know the historical mean of your process, or if you have an estimate obtained from past data, enter the value to use in the analysis.
- Historical standard deviation
- If you know the historical standard deviation of your process, or if you have an estimate
obtained from past data, enter the value to use in the analysis.
You can also specify the Historical standard deviation within subgroups and the Historical standard deviation between subgroups for a between/within capability analysis.
If you want to specify the method that Minitab uses to estimate the standard deviation from your sample data, specify the methods for the Estimation.
- Historical proportion
- If you know the historical proportion of your process, or if you have an estimate obtained from past data, enter the value to use in the analysis.
Estimation
- Estimation method for within-subgroup standard deviation
- Select a method for estimating the within-subgroup standard
deviation.
- Pooled standard deviation: The pooled standard deviation is the weighted average of subgroup variances, which gives larger subgroups more influence on the overall estimate. This method provides the most precise estimate of standard deviation when the process is in control.
- Rbar: Rbar is the average of the subgroup ranges. This method is a common estimate of the standard deviation and works best with subgroup sizes from 2 to 8.
- Sbar: Sbar is the average of the subgroup standard deviations. This method provides a more precise estimate of the standard deviation than Rbar, especially with subgroup sizes > 8.
- Estimation method for between-subgroup standard deviation
-
Select a method for estimating the between-subgroup standard deviation.
- Average moving range: The average moving range is the average value of the moving range of two or more consecutive points. This method is commonly used when the subgroup size is 1.
- Median moving range: The median moving range is the median value of the moving range of two or more consecutive points. This method is best to use when data have extreme ranges that could influence the moving range.
- Square root of MSSD: The square root of MSSD is the square root of the mean of the squared differences between consecutive points. Use this method when you cannot reasonably assume that at least 2 consecutive points were collected under similar conditions.
- Length of moving range
- Enter the number of observations used to calculate the moving range. The length must be ≤ 100. The default length is 2 because consecutive values have the greatest chance of being alike.
- Use unbiasing constants
- Unbiasing constants reduce the bias that can occur when a parameter
is estimated from a small number of observations. As the number of observations
increases, unbiasing constants have less effect on the calculated results.
- To calculate within-subgroup standard deviation: Use unbiasing constants in the estimate of the within-subgroup standard deviation. This option applies to the Sbar, pooled standard deviation, and square root of MSSD methods with the Normal Capability Analysis.
- To calculate between/within-subgroup standard deviations: Use unbiasing constants in the estimates of the within- and between-subgroup standard deviations. This option applies to the Sbar, pooled standard deviation, and square root of MSSD methods with the Between/Within Capability Analysis.
- To calculate overall standard deviation: Use unbiasing constants in the estimate of the overall standard deviation.
Transformation
- Box-Cox transformation
- Use the Box-Cox transformation if your nonnormal data are all
positive (> 0) and you want to obtain estimates of within-subgroup
(potential) capability as well as overall capability.
Select the lambda (λ) value to transform the data.
- Optimal λ: Use the optimal lambda, which should produce the best fitting transformation.
- λ = 0 (natural log): Use the natural log of your data.
- λ = 0.5 (square root): Use the square root of your data.
- Specified λ
- Enter a value for lambda. Other common transformations are square (λ = 2), inverse square root (λ = −0.5), and inverse (λ = −1). In most cases, you should not use a value outside the range of −2 and 2.
Capability statistics options
- Target
- If your process has a target, enter the value. If you enter a target value, Minitab Connect calculates Cpm, a capability index that also considers how much the data deviate from the target.
- Tolerance of K * σ
- Enter the width of the tolerance in number of standard deviations (σ). By default, the
tolerance is 6 standard deviations wide (3 standard deviations on
each side of the process mean).
Minitab Connect interprets the K value as the width of a two-sided tolerance. If you want to use a one-sided tolerance, enter a two-sided tolerance value that is twice that of the one-sided tolerance. For example, if you want to use a one-sided tolerance of 3σ, enter 6.
- Perform analysis
- For Between/Within Capability Analysis, you can decide to perform both between and within-subgroup
capability analysis and overall capability analyses.
- Between/within-subgroup and overall: Perform both between and within-subgroup and overall capability analyses.
- Between/within-subgroup only: Perform the between and within-subgroup analysis, which assesses the variation both within and across subgroups. This analysis estimates how well your process could perform if other sources of systemic variation, besides the variation between and within-subgroups, could be eliminated.
- Overall only: Perform the overall analysis, which indicates the actual capability of your process. This analysis estimates what your customer actually experiences.
- Display performance metrics
- Select how you want to display the expected and observed
out-of-specification values.
- Parts per million: Display the values in parts per million (PPM).
- Percents: Display the values as percentages.
- Display capability metrics
- Select the measures of capability to display.
- Capability stats (Cp, Pp): Calculate and display capability indices, such as Cp and Pp.
- Benchmark Z's (σ level): Calculate and display Z.bench values. The choice to use Z.bench often depends on company or industry practices.
- Display CCpk
- Display the potential capability measure CCpk, which uses the information from a process target, center of the specification spread, or process average.
- Display confidence intervals
- Select to display confidence intervals for the capability indices.
- Historical mean and Historical proportion
- If you know the historical mean or proportion of your process, or if you have an estimate obtained from past data, enter the value to use in the analysis.
- Target defects per unit (DPU) and Target percent defective
- If you have a target for your process, enter the value to use for the analysis. If you do not enter a target value, Minitab Connect assumes that the target is 0.
- Tests for special causes
-
Minitab Connect provides eight tests for special causes for variables control
charts and four tests for special causes for attributes control
charts.
Use the tests to determine which observations to investigate, and to identify the specific patterns and trends in your data. By default, Minitab Connect uses only Test 1. Select additional tests based on company or industry standards.
For more information on changing the test defaults, go to Customize tests for special causes.
- Point label options
- Check Test failure label to display the test number of a failed test.
Check Marked point label to display the label of a marked point.