The supervisor for a call center wants to determine whether the call answering process is in control. The supervisor records the total number of incoming calls and the number of unanswered calls for 21 days.
The supervisor creates a P chart to monitor the proportion of unanswered calls.
-
Open the Prep tool
 and import the data into a new table.
This example uses the data set in the Minitab Data Set Library, Unanswered calls data.
and import the data into a new table.
This example uses the data set in the Minitab Data Set Library, Unanswered calls data.Note
You cannot import a Minitab worksheet (MTW) into Minitab Connect. To import the data, save it as a CSV, XLSX, or copy and paste it. For more information on how to import data, go to Common tasks using the Base tool and select Import data to a new table from an Excel file.
-
Open the SPC tool
 .
.
- In the first dropdown box, select Current Config.
- In Statistic, select P Chart.
- In Variable, select Unanswered Calls.
- In Subgroup sizes, select By variable.
- In Subgroup size value, enter Total Calls.
- Select Options, and then select Tests.
- Select 1 point > K standard deviations from center line (Test 1) and K points in a row on same side of center line (Test 2). If you are not sure which tests apply in your specific situation, use Tests 1 and 2 when you first establish the control limits based on your data.
-
Select Run
 .
.
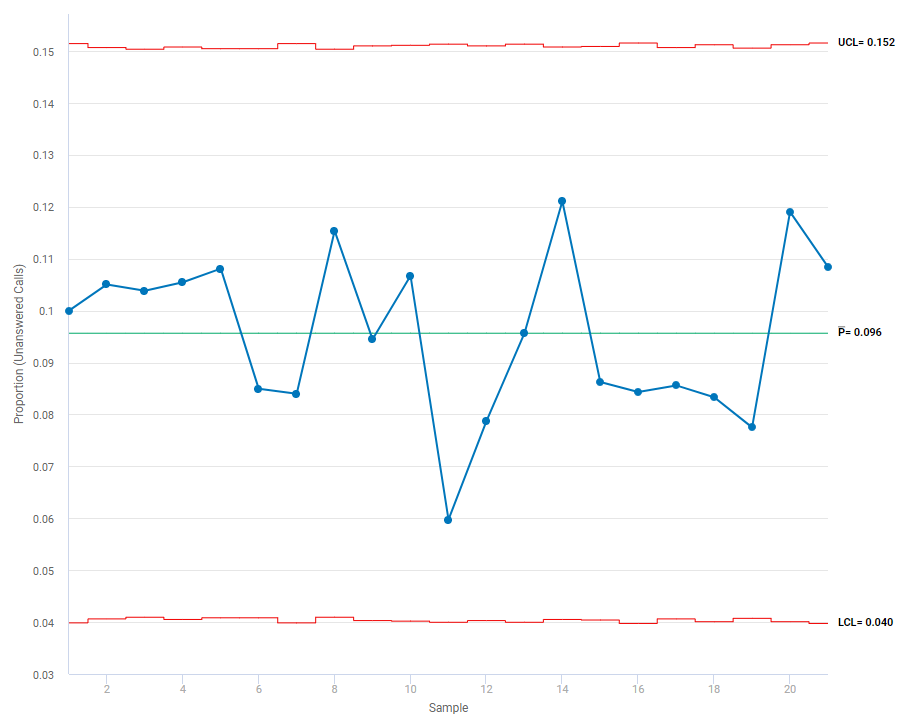
Interpret the results
The chart shows that, on average, 9.6% of calls are unanswered. None of the subgroup proportions are outside of the control limits. Furthermore, the points inside the limits display a random pattern. This P chart does not provide any evidence for lack of control. Thus, the process is in control.