Customize tests for special causes
Follow these steps to change the test settings. When you customize the test settings, the change only applies to the current control chart.
-
Open the SPC tool
 .
.
- In the first dropdown box, select Current Config.
- In Statistic, select the control chart to create.
- Enter the data and subgroup information.
- Select Options, and then select Tests.
- Enter numeric values for K for any test that you want to change.
- Under Point label options, change any display options for the points that you want.
-
Select Run
 .
.
Use historical parameters to calculate the center line and control limits
Follow these steps to use historical parameters in the center line and control limit calculations. When you customize the parameters, the change applies only to the current control chart.
-
Open the SPC tool .
- In the first dropdown box, select Current Config.
- In Statistic, select the control chart to create.
- Enter the data and subgroup information.
- Select Options, and then select Parameters.
- Enter the historical parameters that you want to set.
-
Select Run
.
Use a subset of data to calculate the center line and control limits
Follow these steps to use a subset of data in the center line and control limit calculations. When you customize the calculation method, the change only applies to the current control chart.
Note
You must have a saved view of the subset of data. For more information on how to create a saved view, go to Common tasks using the Prep tool and select Create a custom data view.
-
Open the SPC tool .
- In the first dropdown box, select Current Config.
- In Statistic, select the control chart to create.
- Enter the data and subgroup information.
- Select Options.
- Under Calculation Method, select Subset (View) and select the view that contains your subset of data.
-
Select Run
.
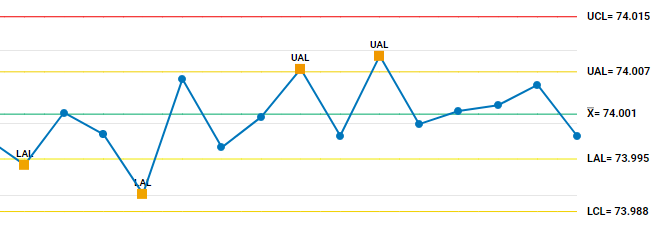
Add reference line and marked points
If you create a combo chart, like an Xbar-R chart, you can add a reference line to the first chart, the second chart, or both. Follow these steps to add a reference line, such as an action limit, and mark the points that violate the limit. When you customize the reference line, the change applies only to the current control chart.
-
Open the SPC tool .
- In the first dropdown box, select Current Config.
- In Statistic, select the control chart to create.
- Enter the data and subgroup information.
- Select Options.
- Under Series 1 Plot Lines, select Add Plot Line.
- Rename the line to Upper Action Limit.
-
Select the View(s) button
 .
.
- In Value, enter the value at which to draw the reference. For this example, use 74.007.
- Repeat step 7-9 with the name Lower Action Limit and the value 73.995.
- In Mark Points, specify when to mark the plotted points. For this example, the UAL = Above Value and the LAL = Below Value. You can change the line colors and styles for each line and mark color.
-
Select Run
.
Specify a Box-Cox transformation
Follow these steps to transform your nonnormal data for a capability analysis. This transformation applies only to the current normal or between/within capability analysis.
-
Open the SPC tool .
- In the first dropdown box, select Current Config.
- In Statistic, select Normal Capability Analysis or Between/Within Capability Analysis.
- Enter the data, subgroup, and specification information.
- Select Options, and then select Transformation.
- Under Box-Cox transformation, select Optimal λ.
-
Select Run
.
Change capability analysis metrics
Follow these steps to change the metric units for a capability analysis. These settings apply only to the current normal or between/within capability analysis.
-
Open the SPC tool .
- In the first dropdown box, select Current Config.
- In Statistic, select Normal Capability Analysis or Between/Within Capability Analysis.
- Enter the data, subgroup, and specification information.
- Select Options, and then select Capability statistics options.
- Under Display performance metrics, select Percents.
- Under Display capability metrics, select Benchmark Z's (σ level).
- Select Display CCpk and Display confidence intervals.
-
Select Run
.