Dashboards provide powerful resources for proactive data monitoring. You can share your custom dashboards with anyone inside or outside of your organization. Dashboards allow you to create graphs and visualizations that you can easily resize and reposition.
Note
Your Connect subscription must have the Custom Dashboards add-on. Additionally, if you have the add-on but your user role is Dashboard Viewer, you will be limited in your ability to use the dashboard.
In this example, a marketing analyst wants to investigate the age of the customer. The analyst wants to add a histogram that shows the distribution of ages.
-
From the Home screen
 ,
select the Minitab Connect button
,
select the Minitab Connect button  to open the Navigation pane. Under Dashboards, select Add New Dashboard.
Or, from the Home screen, select the Add button under Dashboards.
to open the Navigation pane. Under Dashboards, select Add New Dashboard.
Or, from the Home screen, select the Add button under Dashboards.
-
Select the Data icon
 and select Add Data.
- Select the Folder and Table that contain the saved data view. Then in Select a data view, select Online Downloads.
- Select Open View.
-
Select the Assets icon
 and double click Histogram.
- Select Open.
- In Continuous variables enter Age.
- Select Create
The dashboard now displays the histogram.
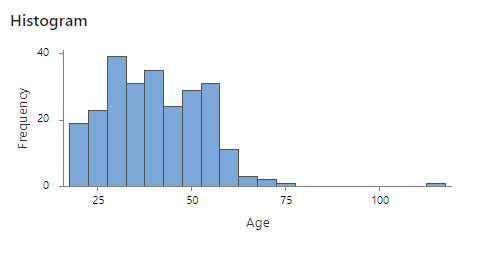
The histogram shows an age well above 100 years. This outlier alerts the analyst, who decides to investigate the reason for the incorrect data point.