Add a filter to the dashboard to easily narrow a number range, date range, or set of categories instead of creating a new view with that filter in the table.
In this example, the marketing analyst knows that their supervisors are interested in
customers between the ages of 40 and 60. The analyst creates a bar chart to show the
number of books per genre that customers buy. Then, the analyst adds a filter in the
dashboard to show only customers between the ages of 40 and 60.
Note
Filters allow you to change the dashboard while you view it. While you edit a dashboard, the data include the entire range of possible values.
-
Select the Assets icon
 and double click Bar Chart.
- Select Open.
- In Categorical variables enter Genre.
- Select Create
-
Select the Assets icon and double click Number Range Slicer.
- On the right navigation, under Variable select Age.
- In the number range, enter 40 for the lower endpoint and 60 for the upper endpoint. When you are in Edit mode, you can select preset values for the slicer in the pane. After you save the dashboard, the slicer uses the preset values you specify as the default values when in Present mode. You can adjust these values in Present mode, but the slicer reverts to the preset values when you refresh the dashboard or begin a new session. If you want to change the default values for the slicer, you must do so in Edit mode.
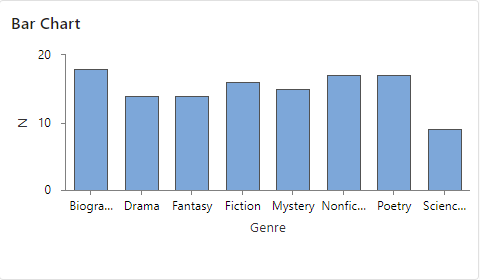
Each asset on the dashboard displays only rows of data where the age is between 40 years and 60 years. The analyst easily sees that this age range bought between 13 and 16 books of each genre except for Science Fiction, which had only 8 purchases.