Note
Every data table includes four system fields, which are created by Minitab Connect and help identify the data. You cannot remove system fields from the table; however, they do not appear unless you add them to a view.
Follow these instructions to create a summary view of the data.
- On the Fields tab, select Remove All Field(s) to start with an empty field list. Depending on the number of columns, it may be easier to add or remove fields.
- Under Add a Field, select the fields to add to the view. For this example, add Purchase Date and Genre. For this example, we also need to add System: ID, which is a unique ID for each record.
-
Under System: ID, select the View button
 .
.
- Select Add Prep and select Count. For this example, the analyst wants a summary of each genre for each day.
-
Select Save
 .
.
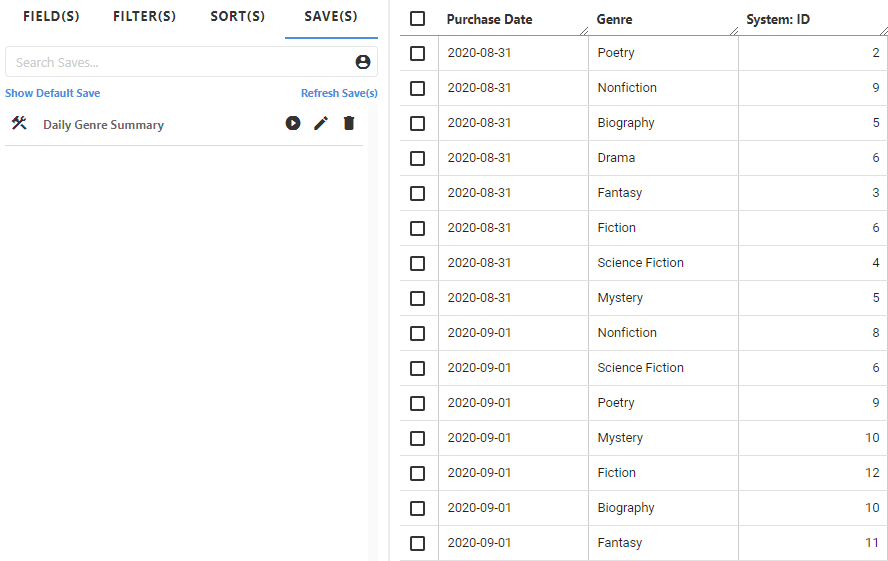
- Under View, select New View. Under Name, enter Daily Genre Summary to identify the new view.
- Select Save.
You now have a saved view called Daily Genre Summary that you can use throughout the Minitab Connect platform to view the summary data.

When you add aggregate data preparations such as Count, Sum, Min, or Max, the results are sorted by the other fields that do not have an aggregate Prep. For this example, the data are sorted by Purchase Date and Genre.
Tip
You might find it helpful to rename the system field with a more meaningful name. From the Fields tab, highlight the name you want to change and enter a new name.

In this example, Total Downloads is more descriptive.
You can create other views at any time. Open the Audit tool ![]() to
see a list of all the views for the active table.
to
see a list of all the views for the active table.
