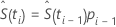
Kaplan-Meier estimation
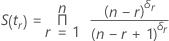
with S(t0) = 1 and t0 = 0.
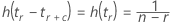
Empirical hazard function
The hazard function describes the rate of failure for an interval. The hazard function is 0 before the first censored observation. The hazard function changes only at uncensored observations. Minitab does not plot the hazard function after the last uncensored data point.
When there are ties, Minitab uses the largest rank in the tie to estimate the hazard function. See Nelson1 for more details.
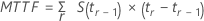
Mean time to failure
For uncensored data, the mean time to failure is the same as the average failure time. The general formula to use with censored or uncensored data follows:
Also, when the largest observation is censored, Minitab treats the time of the largest uncensored observation as a time limit for the calculation. See Lee2 for more details.
Standard error of MTTF
The standard error of the mean time to failure is the square root of the variance. When all observations are uncensored, Minitab calculates an unbiased estimate:
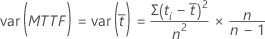
For the cases where some data are censored, the unbiased estimate of the variance is the following formula:
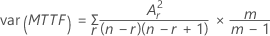
Because of the shape of the empirical hazard function, the areas under the survival curve, Ar, are rectangles with heights equal to the survival function and lengths equal to the intervals between uncensored observations.
Notation
| Term | Description |
|---|---|
| tr | time of the data point with rank r |
| r | rank of the data point, where the earliest failure has the lowest rank |
| n | total number of units |
| δr | 0 if the jth observation is censored or 1 if the jth observation is uncensored |
| c | number of data points until the next uncensored observation |
| S(tr) | empirical survival function at time tr |
 | average failure stress |
| Ar | area under the curve of the survival plot to the right of tr |
| m | total number of uncensored observations |
References
1. W. Nelson (1982). Applied Life Data Analysis. John Wiley & Sons, Inc. 133.
2. Elisa T. Lee (1992). Statistical Methods for Survival Data Analysis, Second Edition. John Wiley & Sons, Inc. 73-76.
Actuarial estimation
The actuarial model is an alternative nonparametric analysis that displays information for groupings of failure times. The Kaplan-Meier method assumes that the suspensions in an interval occur at the end of that interval, after the failures have occurred. Minitab's actuarial model assumes that the suspensions occur in the middle of the interval, which has the effect of reducing the number of available units in the interval. The estimate of the survival function using the actuarial method is as follows:
 for i = 0
 for i > 0
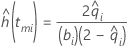
Empirical hazard function
The hazard function describes the rate of failure for an interval. With actuarial estimation, you assume that the calculation is for the midpoint of the interval. On the hazard plot, the function is drawn from midpoint to midpoint. For more details, see the references following the Notation section.
Notation
| Term | Description |
|---|---|
| ni | the number of units entering an interval |
| di | the number failing in the interval |
| n'i |  |
 | the number censored in an interval |
 | the conditional probability of an event, which equals di/n'i |
 |  |
| tmi | time at the midpoint of the actuarial interval |
| bi | the length of the actuarial interval |
References
Collett, D. (1994) Modelling Survival Data in Medical Research, Chapman and Hall.
Lee, Elisa T. (1992) Statistical Methods for Survival Data Analysis, 2nd Edition, John Wiley & Sons.
Turnbull estimation
Turnbull1, 2 developed an iterative algorithm to compute a nonparametric maximum likelihood estimate of the cumulative distribution function for the data. This method applies to more general situations, for example, where the intervals are overlapping.
Minitab displays output summarizing the Turnbull estimate of the interval probabilities, along with standard errors for these probabilities.
References
- B.W. Turnbull (1976). "The Empirical Distribution Function with Arbitrarily Grouped, Censored and Truncated Data," Journal of the Royal Statistical Society 38, pp. 290-295.
- B.W. Turnbull (1974). "Nonparametric Estimation of a Survivorship Function with Doubly Censored Data," Journal of the American Statistical Association 69, 345, pp. 169-173.
Confidence intervals
Regardless of the estimation method, Minitab uses a normal approximation to calculate confidence intervals. The confidence intervals are as follows:
Formula
Estimate of the survival probability  zα × Standard error of the estimate
Notation
| Term | Description |
|---|---|
| zα | the  upper critical value for the standard normal distribution upper critical value for the standard normal distribution |
| α | the confidence level |