In This Topic
Anderson-Darling statistic
The Anderson-Darling statistic is a measure of how far the plot points fall from the fitted line in a probability plot. The statistic is a weighted squared distance from the plot points to the fitted line with larger weights in the tails of the distribution. Minitab uses an adjusted Anderson-Darling statistic, because the statistic changes when a different plot point method is used.
Minitab provides an Anderson-Darling statistic for the maximum likelihood and least squares estimation methods.
Formula
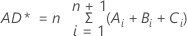
Notation
| Term | Description |
|---|---|
| n | number of plotted points |
| Ai |
 |
| Bi |
 |
| Ci |
 |
| zi | fitted estimate of the cumulative distribution function for the ith point |
| Fn(zi) | the point plotted for the ith data point |
| z0 | equals 0 |
| Fn(z0) | equals 0 |
| lnn(z0) | equals 0 |
| zn+1 |
 |
Pearson correlation coefficient
For least squares estimation, Minitab calculates a Pearson correlation coefficient. If the distribution fits the data well, then the plot points on a probability plot will fall on a straight line. The correlation, usually signified by r (rho), measures the strength of the linear relationship between the X and Y variables on a probability plot.