In This Topic
Step 1: Examine the fitted regression line to assess linearity
Linearity assesses the difference in average bias through the expected operating range of the measurement system.
Use the Bias versus Reference Value plot to see how the bias values vary for each part. For each reference value, the blue circles represent the bias values, and the red squares represent the average bias value.
The bias is the difference between a part's reference value and the operator's measurements of the part. The average bias values are also listed in the Gage Bias table under Bias.
A line is fitted through the bias values, using ordinary least squares regression. You want the data to form a horizontal line, which indicates that the bias does not change across the size of the parts, and that the measurement system does not contain significant bias. When the horizontal line is close to 0, the difference between the observed average measurement and the reference value is very small, which also indicates that the system does not contain significant bias
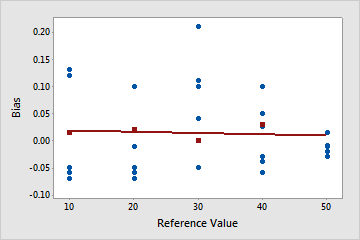
Bias is very small across all parts
This is the ideal case—the line is horizontal and close to 0. Bias is very small for each part, and the horizontal line indicates that linearity is not a problem.
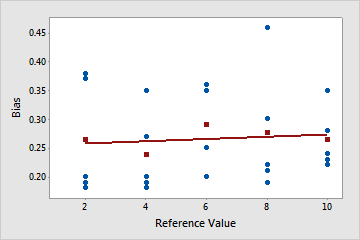
Linearity does not appear to be a problem
The plotted line is close to horizontal, which indicates that the average bias is relatively constant and does not depend on the reference value. In this example, the measurements for all parts are higher than their corresponding reference part measurements.
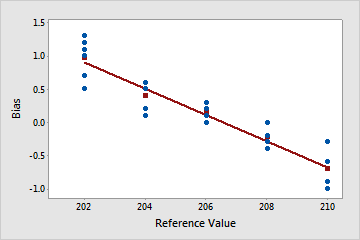
Linearity appears to be a problem
The plotted line is sloped. In this example, measurements for smaller parts are higher than their corresponding reference part values. Measurements for larger parts tend to be lower than their corresponding reference part values.
Step 2: Determine whether the gage linearity is statistically significant
Generally, the closer the slope of the fitted line is to zero, the better the gage linearity. Ideally, the fitted line will be horizontal and will be close to 0.
- If the p-value is greater than 0.05, you can conclude that linearity is not present and you can assess bias. Use the p-value for the average bias to assess whether the average bias is significantly different from 0.
- If the p-value is less than or equal to 0.05, you can conclude that linearity is a problem. You can assess the bias at each individual reference value, but not the overall bias. You cannot assess the overall bias when significant linearity is present because the biases at different reference values are different. In other words, when the linearity is statistically significant, interpret the bias p-values for the individual reference levels only.
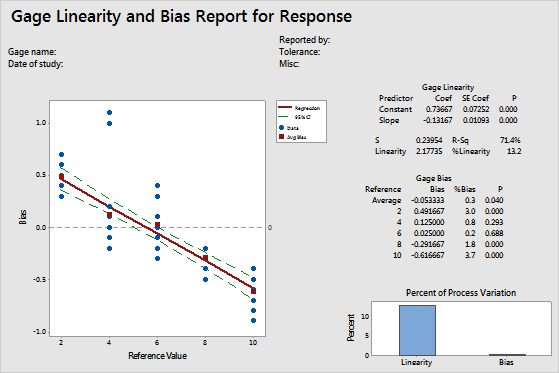
Key Result: Gage Linearity P
In these results, the p-value for the slope is 0.000, which indicates that the slope is significant and that linearity is present in the measurement system. Because the linearity is statistically significant, you must use individual bias values and not the average overall bias value.
Step 3: Determine whether the gage bias is statistically significant
The bias is the difference between a part's reference value and the operator's measurements of the part. Examine the %Bias for each reference value and the Average %Bias. The Average %Bias value is the bias expressed as a percent of the process variability.
- A positive bias indicates that the gage measures high.
- A negative bias indicates that the gage measures low.
For a gage that measures accurately, the %Bias value is also small.
Use the p-values used to test whether bias = 0 at each reference value and for the average bias.
Key Results: %Bias, Gage Bias P
In these results, the %Bias values vary from 0.2 to 3.7, and their p-values vary from 0.000 to 0.688. Because linearity is present, interpret the bias p-values for the individual reference levels only, and do not use the overall average bias value. Reference values 2, 8, and 10 have bias, whereas, reference values 4 and 6 do not seem to have a bias in their measurements.