In This Topic
Standard deviation (StDev)
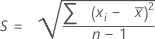
The standard deviation is the most common measure of dispersion, or how spread out the data are about the mean. The sample standard deviation is equal to the square root of the sample variance.
 , then the standard deviation is given by:
Notation
| Term | Description |
|---|---|
| xi | the ith observation in your sample |
 | the sample mean |
| S | the sample standard deviation |
| n | sample size |
Variance
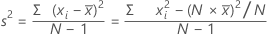
The variance measures how spread out the data are about their mean. The variance is equal to the standard deviation squared.
Formula
Notation
| Term | Description |
|---|---|
| xi | ith observation |
 | mean of the observations |
| N | number of nonmissing observations |
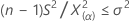
Confidence intervals and bounds for the chi-square method
Confidence intervals


Confidence bounds
When you specify a one-sided test, Minitab calculates a one-sided 100(1–α)% confidence bound, according to the direction of the alternative hypothesis.
- If you specify a "greater than" alternative hypothesis, a 100(1–α)% lower bound for the population standard deviation is given by:

A 100(1–α)% lower bound for the population variance is given by:
- If you specify a "less than" alternative hypothesis, a 100(1–α)% upper bound for the population standard deviation is given by:

A 100(1–α)% upper bound for the population variance is given by:

Notation
| Term | Description |
|---|---|
| α | alpha-level for the 100(1 – α)% confidence interval |
| n | sample size |
| S2 | sample variance |
| Χ2(p) | the upper 100pth percentile point on a chi-square distribution with (n – 1) degrees of freedom |
| σ | true value of the population standard deviation |
| σ2 | true value of the population variance |
Confidence intervals and bounds for the Bonett method
Use this method for any continuous data (normal or nonnormal). 1
Confidence interval


Confidence bounds
When you specify a one-sided test, Minitab calculates a one-sided 100(1–α)% confidence bound, according to the direction of the alternative hypothesis.
-
If you specify a "greater than" alternative hypothesis, a 100(1–α)% lower bound for the population standard deviation is given by:
 An approximate 100(1- a)% lower bound for the population variance is given by:
-
If you specify a "less than" alternative hypothesis, an approximate 100(1 – α)% upper bound for the population standard deviation is given by:
 An approximate 100(1- a)% upper bound for the population variance is given by:
Notation
| Term | Description |
|---|---|
| α | 1 – confidence level / 100 |
| cα/2 | n / (n – zα/2) |
| cα | n / (n – zα ) |
| s2 | observed value of the sample variance |
| zα/2 | inverse cumulative probability of the standard normal distribution at 1 – α/2. If n is less than or equal to zα/2, Minitab does not calculate Bonett confidence intervals. |
| zα | inverse cumulative probability of the standard normal distribution at 1 – α. If n is less than or equal to zα , Minitab does not calculate Bonett confidence intervals. |
| se | 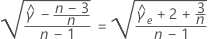 |
 | 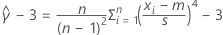 = estimated excess kurtosis = estimated excess kurtosis |
| m | trimmed mean with trim proportion equal to  ; m = sample mean when n is less than or equal to 5 ; m = sample mean when n is less than or equal to 5 |
| σ | true value of the population standard deviation |
| σ2 | true value of the population variance |
Hypothesis test for the chi-square method
Formula
The hypothesis test uses the following p-value equations for the respective alternative hypotheses:
H1: σ2 > σ02: p-value = P(Χ2 ≥ x2)
H1: σ2 < σ02: p-value = P(Χ2 ≤ x2)
H1: σ2 ≠ σ02: p-value = 2 × min{P(Χ2 ≤ x2), P(Χ2 ≥ x2)}
Notation
| Term | Description | ||||||
|---|---|---|---|---|---|---|---|
| σ2 | true value of the population variance | ||||||
| σ02 | hypothesized value of the population variance | ||||||
| Χ2 | follows a chi-square distribution with (n – 1) degrees of freedom when σ2 = σ02 | ||||||
| x2 | 
|
Hypothesis test for the Bonett method
Formula
The Bonett procedure is not associated with a test statistic. However, Minitab uses the rejection regions defined by the confidence limits to calculate a p-value.
For a two-sided hypothesis, the p-value is given by:
p = 2 × min(αL, αU)
- For a one-sided "less than" alternative hypothesis, the p-value is calculated as αU after replacing α/2 with α in the notation.
- For the one-sided "greater than" alternative hypothesis, the p-value is calculated as αL after replacing α/2 with α in the notation.
Notation
| Term | Description | ||||||
|---|---|---|---|---|---|---|---|
| σ02 | hypothesized variance | ||||||
| αL | smallest solution, α, of the equation
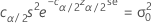 | ||||||
| αU | smallest solution, α, of the equation
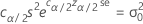 | ||||||
| cα/2 | n / (n – zα/2) | ||||||
| α | 1 – confidence level / 100 | ||||||
| s2 | observed value of the sample variance | ||||||
| zα/2 | inverse cumulative probability of the standard normal distribution at 1 – α/2. If n is less than or equal to zα/2, Minitab does not calculate Bonett confidence intervals. | ||||||
| se | 
|


