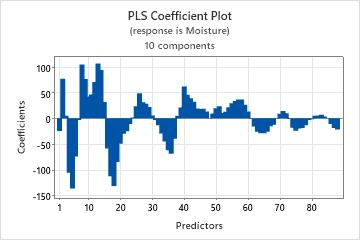
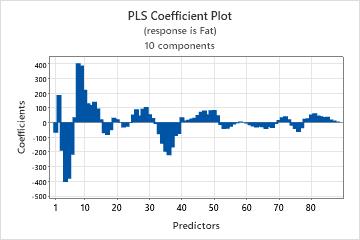
A scientist at a food chemistry laboratory analyzes 60 soybean flour samples. For each sample, the scientist determines the moisture and fat content, and records near-infrared (NIR) spectral data at 88 wavelengths. The scientist randomly selects 54 of the 60 samples and estimates the relationship between the responses (moisture and fat) and the predictors (the 88 NIR wavelengths) using PLS regression. The scientist uses the remaining 6 samples as a test data set to evaluate the predictive ability of the model.
In New observation for
continuous predictors, enter Test1-Test88.
In New observation for
responses (optional), enter Moisture2Fat2.
Click OK in each dialog box.
Interpret the results
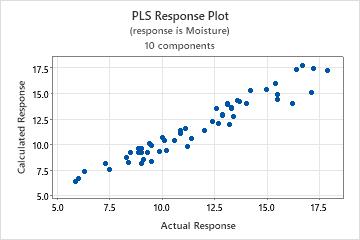
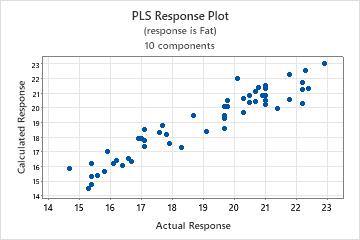
The p-values for both responses are approximately 0.000, which are less than the significance level of 0.05. These results indicate that at least one coefficient in the model is different from zero. The test R2 value for moisture is approximately 0.9. The test R2 value for fat is almost 0.8. The test R2 statistics indicate that the models predict well. The analysis of each response individually would provide different results.
Syntax Error
Syntax Error
Analysis of Variance for Fat
Source
DF
SS
MS
F
P
Regression
10
266.378
26.6378
36.89
0.000
Residual Error
43
31.050
0.7221
Total
53
297.428
Model Selection and Validation for Moisture
Components
X Variance
Error
R-Sq
1
0.984976
96.9288
0.806643
2
0.996400
88.9900
0.822479
3
0.997757
71.9304
0.856510
4
0.999427
58.3174
0.883666
5
0.999722
58.1261
0.884048
6
0.999853
48.5236
0.903203
7
0.999963
45.9824
0.908272
8
0.999976
33.1545
0.933862
9
0.999982
32.8074
0.934554
10
0.999986
32.7773
0.934615
Model Selection and Validation for Fat
Components
X Variance
Error
R-Sq
1
0.984976
282.519
0.050127
2
0.996400
229.964
0.226824
3
0.997757
115.951
0.610155
4
0.999427
98.285
0.669550
5
0.999722
57.994
0.805015
6
0.999853
53.097
0.821480
7
0.999963
52.010
0.825133
8
0.999976
48.842
0.835784
9
0.999982
34.344
0.884529
10
0.999986
31.050
0.895604
Predicted Response for New Observations Using Model for Moisture
Row
Fit
SE Fit
95% CI
95% PI
1
14.5184
0.388841
(13.7343, 15.3026)
(12.5910, 16.4459)
2
9.3049
0.372712
(8.5532, 10.0565)
(7.3904, 11.2193)
3
14.1790
0.504606
(13.1614, 15.1966)
(12.1454, 16.2127)
4
16.4477
0.559704
(15.3189, 17.5764)
(14.3562, 18.5391)
5
15.1872
0.358044
(14.4652, 15.9093)
(13.2842, 17.0903)
6
9.4639
0.485613
(8.4846, 10.4433)
(7.4492, 11.4787)
Predicted Response for New Observations Using Model for Fat