An engineer selects 10 parts that represent the expected range of the process variation. Three operators measure the 10 parts, three times per part, in a random order.
The engineer performs a crossed gage R&R study to assess the variability in measurements that may be from the measurement system.
- Open the sample data, GageData.MWX.
- Choose .
- In Part numbers, enter Part.
- In Operators, enter Operator.
- In Measurement data, enter Measurement.
- Under Method of Analysis, select ANOVA.
- Click the Options button. Under Process tolerance, select Upper spec - Lower spec, and enter 8.
- Click OK in each dialog box.
Interpret the results
The two-way ANOVA table includes terms for the part, the operator, and the part-operator interaction. If the p-value for the interaction is ≥ 0.05, Minitab omits the interaction from the full model because it is not significant. In this example, the p-value is 0.974, so Minitab generates a second two-way ANOVA table that omits the interaction from the final model.
Use the variance components (VarComp) to compare the variation from each source of measurement error to the total variation. In these results, the %Contribution column in the Gage R&R table shows that the variation from Part-To-Part is 92.24%. This value is much larger than Total Gage R&R, which is 7.76%. Thus, much of the variation is due to differences between parts.
Use %Study Var to compare the measurement system variation to the total variation. The Total Gage R&R equals 27.86% of the study variation. The Total Gage R&R %Contribution might be acceptable depending on the application. For more information, go to Is my measurement system acceptable?.
For this data, the number of distinct categories is 4. According to the AIAG, you need at least 5 distinct categories to have an adequate measuring system. For more information, go to Using the number of distinct categories in a gage R&R study.
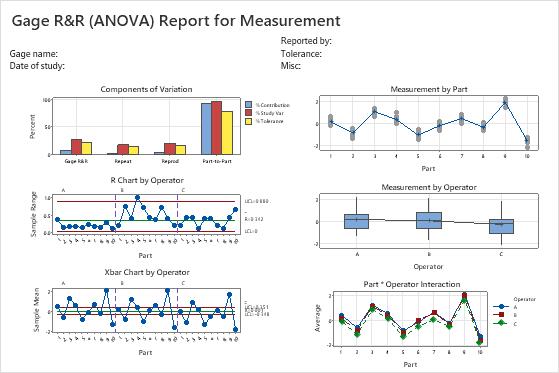
- In the Components of Variation graph, the %Contribution from Part-To-Part is larger than that of Total Gage R&R. Thus, much of the variation is due to differences between parts.
- The R Chart by Operator shows that Operator B measures parts inconsistently.
- In the Xbar Chart by Operator, most of the points are outside the control limits. Thus, much of the variation is due to differences between parts.
- The By Part graph shows that the differences between parts are large.
- In the By Operator graph, the differences between operators are smaller than the differences between parts, but are significant (p-value = 0.00). Operator C's measurements are slightly lower than the measurements of the other operators.
- In the Operator* Part Interaction graph, the lines are approximately parallel and the p-value for the Operator*Part interaction found in the table is 0.974. These results indicate that no significant interaction between each Part and Operator exists.
Two-Way ANOVA Table With Interaction
| Source | DF | SS | MS | F | P |
|---|---|---|---|---|---|
| Part | 9 | 88.3619 | 9.81799 | 492.291 | 0.000 |
| Operator | 2 | 3.1673 | 1.58363 | 79.406 | 0.000 |
| Part * Operator | 18 | 0.3590 | 0.01994 | 0.434 | 0.974 |
| Repeatability | 60 | 2.7589 | 0.04598 | ||
| Total | 89 | 94.6471 |
Two-Way ANOVA Table Without Interaction
| Source | DF | SS | MS | F | P |
|---|---|---|---|---|---|
| Part | 9 | 88.3619 | 9.81799 | 245.614 | 0.000 |
| Operator | 2 | 3.1673 | 1.58363 | 39.617 | 0.000 |
| Repeatability | 78 | 3.1179 | 0.03997 | ||
| Total | 89 | 94.6471 |
Variance Components
| Source | VarComp | %Contribution (of VarComp) |
|---|---|---|
| Total Gage R&R | 0.09143 | 7.76 |
| Repeatability | 0.03997 | 3.39 |
| Reproducibility | 0.05146 | 4.37 |
| Operator | 0.05146 | 4.37 |
| Part-To-Part | 1.08645 | 92.24 |
| Total Variation | 1.17788 | 100.00 |
Gage Evaluation
| Source | StdDev (SD) | Study Var (6 × SD) | %Study Var (%SV) | %Tolerance (SV/Toler) |
|---|---|---|---|---|
| Total Gage R&R | 0.30237 | 1.81423 | 27.86 | 22.68 |
| Repeatability | 0.19993 | 1.19960 | 18.42 | 14.99 |
| Reproducibility | 0.22684 | 1.36103 | 20.90 | 17.01 |
| Operator | 0.22684 | 1.36103 | 20.90 | 17.01 |
| Part-To-Part | 1.04233 | 6.25396 | 96.04 | 78.17 |
| Total Variation | 1.08530 | 6.51180 | 100.00 | 81.40 |