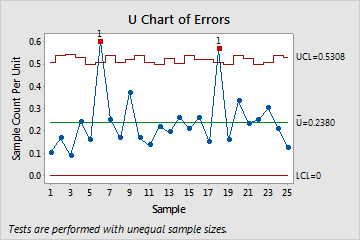
A manager for a transcription company wants to assess the quality of the transcription service. The manager randomly selects 25 sets of pages from consecutive orders and counts the number of typographical errors (defects). Each set has a different number of pages.
The manager creates a U chart to monitor the number of errors.
- Open the sample data, TranscriptionErrors.MWX.
- Choose .
- In Variables, enter Errors.
- In Subgroup sizes, enter Number of Pages.
- Click U Chart Options.
- On the Tests tab, select 1 point > K standard deviations from center line (Test 1) and K points in a row on same side of center line (Test 2).If you are not sure which tests apply in your specific situation, use Tests 1 and 2 when you first establish the control limits based on your data.
- Click OK in each dialog box.
Interpret the results
Because the sample sizes are unequal, the control limits vary. The average number of defects per set of pages is 0.238. Subgroups 6 and 18 failed Test 1 because they are outside of the control limits. Thus, the process is out of control. The manager should identify and correct any factors that contribute to the special-cause variation.

Test Results for U Chart of Errors
| TEST 1. One point more than 3.00 standard deviations from center line. |
|---|
| Test Failed at points: 6, 18 |
