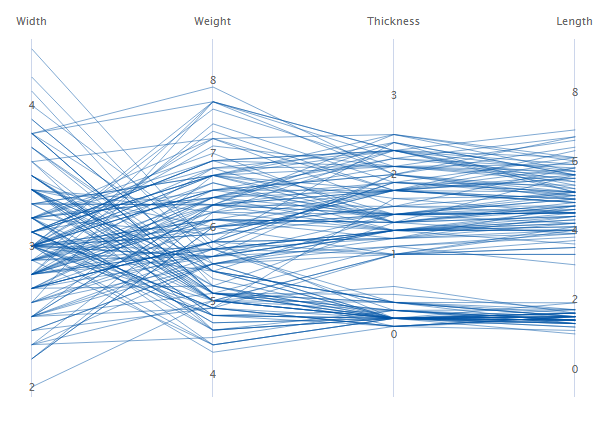
When your choose Standard units or Original data for the y-scale, you can use Sort variables from greatest to least variation in lines to determine which variables have the greatest variation. The greater the series are spread apart for a particular variable, the greater the variation.
For example, this plot shows four different measurements made on 50 similar parts. The data are sorted so the measurements with the greatest variation are on the left side of the plot. The manufacturer wants to minimize the amount of variation in the parts. They can easily see that the width and weight measurements have the most variation. They decide to investigate those measurements to determine whether the measurement gage or the production process is the cause of variation.