About fitted regression lines
Use fitted regression lines to illustrate the relationship between a predictor variable (x) and a response variable (y) and to evaluate whether a linear, quadratic, or cubic regression fits your data.
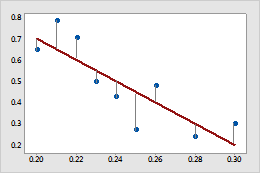
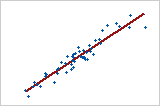
- Linear
- A linear model can show a steady rate of increase or decrease in the
data.
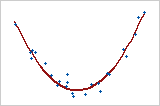
- Quadratic
- A quadratic model (often approximately in the shape of a U or an
inverted U) can explain curvature in the data.
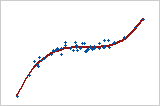
- Cubic
- A cubic model can describe a "peak-and-valley" pattern in the
data.
Example of using fitted regression lines to determine the model
You are studying the relationship between a particular machine setting and the amount of energy consumed. You suspect that this relationship has curvature, but you need to confirm and document the curvature. You produce the following plots. The quadratic model appears to fit the data better than a linear model.
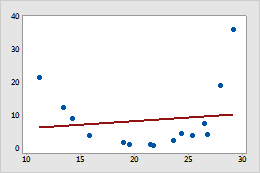
Linear
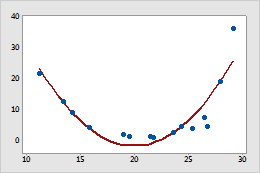
Quadratic
Add a fitted regression line when you create a graph
You can add fitted regression lines when you create a graph, such as a scatterplot or a matrix plot.
- In the dialog box for the graph you are creating, click Data View.
- Click the Regression tab.
- Under Model Order, select the model that fits your data.
- To fit the regression line without the y-intercept, deselect Fit intercept. By default, Minitab includes a term for the y-intercept. Usually, you should include the intercept in the model.
Add a fitted regression line to an existing graph
You can add fitted regression lines to an existing graph, such as a scatterplot or a matrix plot.
- Double-click the graph.
- Right-click the graph and choose .
- Under Model Order, select the model that fits your data.
- To fit the regression line without the y-intercept, deselect Fit intercept. By default, Minitab includes a term for the y-intercept. Usually, you should include the intercept in the model.
Edit fitted regression lines
After you add a fitted regression line, you can edit it.
- Double-click the graph.
- Double-click the fitted regression line. For more information on selecting lines, go to Select groups and single items on a graph.
-
Select the tab to make the edits that you want.
- Attributes: Change the color, size, or line type.
- Groups: Enter a categorical variable for grouping.
- Options: Select the model that fits your data.