Complete the following steps to specify the data for your graph.
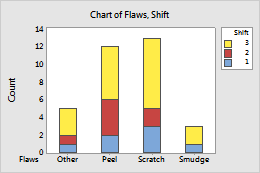
- In Categorical variables (2-4, outermost first), enter two to four columns of categorical data that you want to graph. The first variable is the outermost on the scale and the last variable is the innermost. In the graph below, Flaws is the outermost categorical variable.
- Select Stack categories of last categorical variable to stack the multiple-level groups. If this option is not selected, Minitab displays the multiple-level groups as clustered bars.
In this worksheet, Flaws and Shift are the categorical variables. The graph shows the counts of flaws for each flaw type, stacked by work shift.
| C1-T | C2 |
|---|---|
| Flaws | Shift |
| Scratch | 1 |
| Scratch | 2 |
| Peel | 3 |
| ... | ... |