Complete the following steps to specify the data for your graph.
- In Graph variables, enter multiple columns of numeric or date/time summary data that you want to graph.
- In Row labels, enter a column of categorical data that defines the groups.
- Under Table Arrangement, select one of the following:
- Columns are outermost categories and rows are innermost: Graph variables are the outermost categories and the row labels are the innermost categories. On the graph below, graph variables are outermost on the scale.
- Rows are outermost categories and columns are innermost: Graph variables are the innermost categories and the row labels are the outermost categories.
- Select Stack innermost category values to stack the multiple-level groups. If this control is not selected, Minitab displays the multiple-level groups as clustered bars.
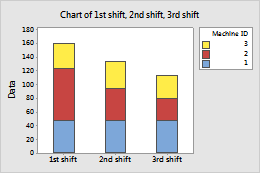
In this worksheet, 1st shift, 2nd shift, and 3rd shift are the graph variables. Machine ID contains the row labels. The graph shows the data for each work shift, stacked by machine.
| C1 | C2 | C3 | C4 |
|---|---|---|---|
| Machine ID | 1st shift | 2nd shift | 3rd shift |
| 1 | 48 | 47 | 48 |
| 2 | 76 | 47 | 32 |
| 3 | 36 | 40 | 34 |