In This Topic
Average rank
- Ranks the combined samples, assigns the smallest observation a rank of 1, the second smallest observation a rank of 2, and so on.
- If two or more observations are tied, Minitab assigns the average rank to both observations.
- Calculates the average of the ranks of each sample.
Minitab displays the values for each group under Ave Rank in the output.
Z-value
Formula
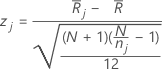
Minitab calculates the z-value for each group as follows:
Notation
| Term | Description |
|---|---|
 | average rank for group j |
 | average rank for all observations |
| N | number of observations |
| nj | number of observations for the jth group |
Ranking tied values
- Sort the observations in ascending order.
- Assign ranks to each observation as if there were no ties.
- For a tied set, take the average of the corresponding ranks and assign this value as the new rank to each tied value in that set.
Example
A sample has 9 observations: 2.4, 5.3, 2.4, 4.0, 1.2, 3.6, 4.0, 4.3, and 4.0
| Observation | Rank (assuming no ties) | Rank |
|---|---|---|
| 1.2 | 1 | 1 |
| 2.4 | 2 | 2.5 |
| 2.4 | 3 | 2.5 |
| 3.6 | 4 | 4 |
| 4.0 | 5 | 6 |
| 4.0 | 6 | 6 |
| 4.0 | 7 | 6 |
| 4.3 | 8 | 8 |
| 5.3 | 9 | 9 |
- The number of sets of ties = 2
- The number of tied values in the first set = 2
- The number of tied values in the second set = 3
H
Formula
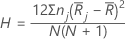
Under the null hypothesis, the chi-square distribution with k – 1 degrees of freedom approximates the distribution of H. The approximation is reasonably accurate when no group has fewer than five observations. A higher H value provides stronger evidence for the null hypothesis that the difference between some of the medians is statistically significant.
Some authors, such as Lehmann (1975)1, suggest adjusting H when the data have ties. Minitab displays H(adj) when the data have ties.
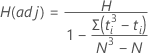
Under the null hypothesis, the chi-square distribution with k – 1 degrees of freedom approximates the distribution of H and H(adj).
P-value = 1 – CDF (χ2H, df)
P-value = 1 – CDF (χ2H(adj), df)
For small samples, Minitab recommends that you use exact tables. For more details, see Hollander and Wolfe (1973)2.
Notation
| Term | Description |
|---|---|
| nj | number of observations in group j |
| N | total sample size |
 | average of the ranks in group j |
 | average of all of the ranks |
| ti | number of tied values in the ith set of ties |