By default, Minitab displays the smallest tree with a misclassification cost that is within 1 standard error of the minimum cost.
- Highlight the 5 most pure nodes. These nodes are the optimal nodes.
- Copy the values of the predictors that lead to a node that you select. These values are the node rules.
- Show the Node Split View. This view is helpful when you have a large tree and want to see only which variables split the nodes.
The root node is the top node of the tree. It is the only node that does not have parents. At each node, the data is split into 2 children, depending on the characteristics of the data. For example, does a heart patient have exercise angina? Nodes continue to split until the tree runs out of data to split. In other words, the terminal nodes cannot be split into further groupings.
When you validate the performance of the tree with a test data set, the tree diagram shows cases from the training data set.
Interpretation
The paths to the terminal nodes in the tree diagram describe how purer groups are formed. The terminal nodes provide information on how to define each purer group with the predictor variables for further study. Each node contains details on the class, the count, and the percentage in the class.
The information contained in the terminal nodes also provides a way to rank all the purer groups by class probabilities, in order to focus your efforts.
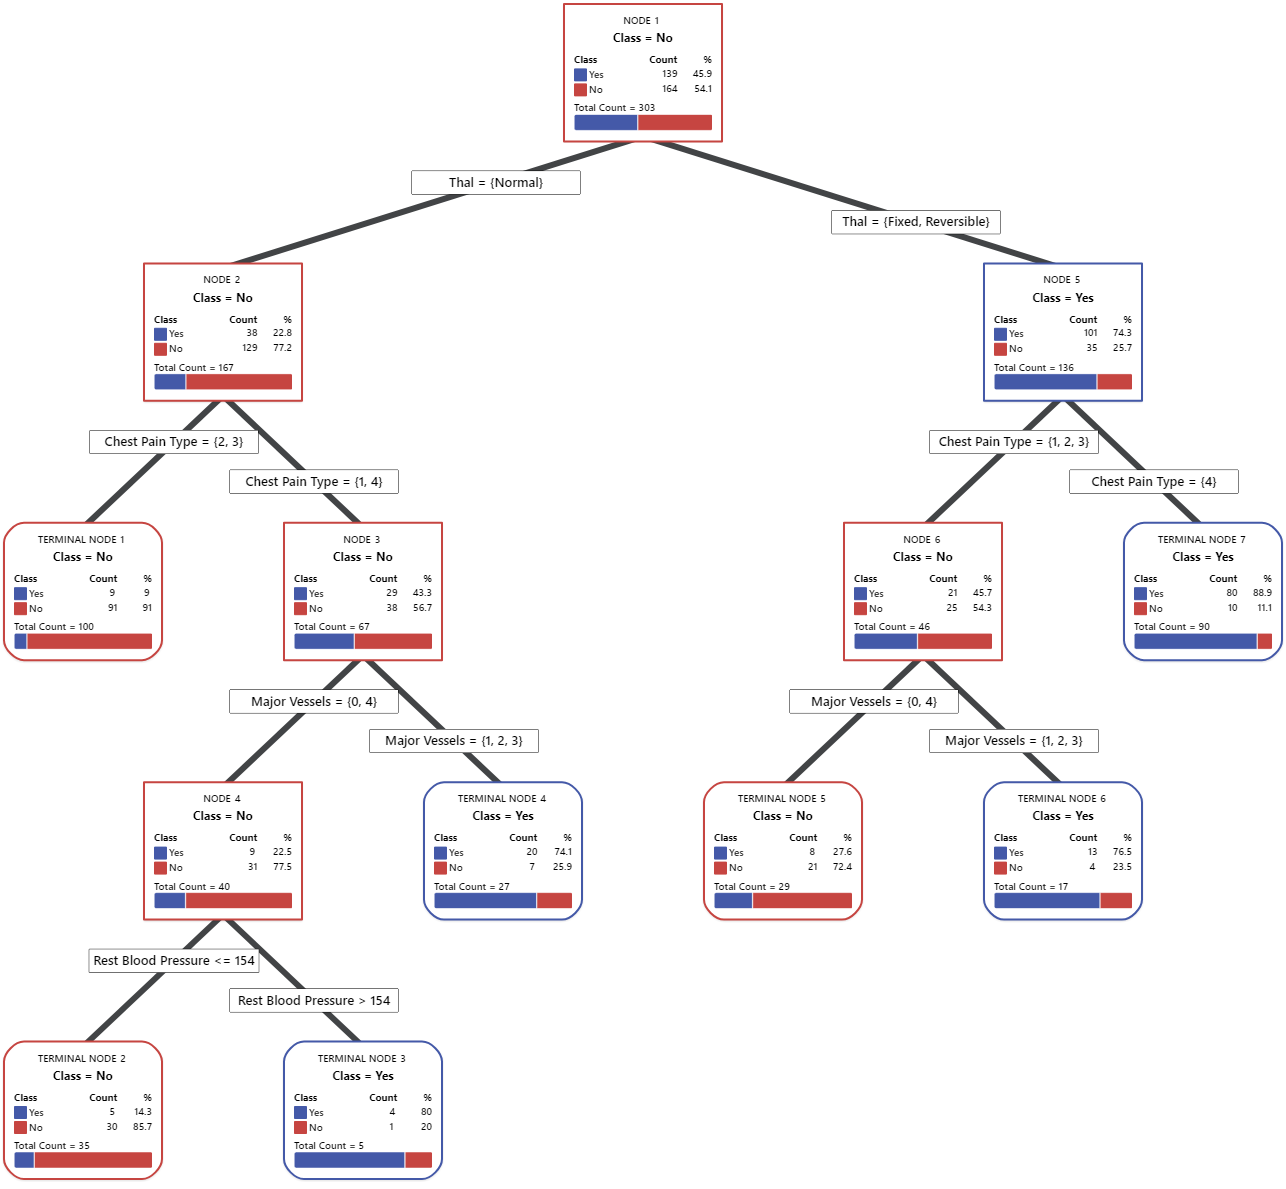
- Node ID
- Gives the node or terminal node designation. The terminal node is a final node that cannot be split further.
- Class
- Each terminal node has a particular class assignment based on class assignment rules. For a binary response, the classes may be "Yes" or "No". For a multinomial response, the classes may be "Q1", "Q2", "Q3", and "Q4".
- Count
- The number of cases for a particular class.
- Percentage
- The percentage of cases for a particular class.
- Total Count
- The sum of counts for all classes.