A quality engineer for a nutritional supplement company wants to assess the calcium content in vitamin capsules. The engineer collects a random sample of capsules and records their calcium content. From past experience, the engineer knows that the data are right-skewed.
The engineer performs the Johnson transformation to transform the data to follow a normal distribution and to store the transformed values in the worksheet for further analysis.
- Open the sample data, CalciumContent.MWX.
- Choose .
- In Data are arranged as, select Single column, then enter Calcium.
- Under Store transformed data in, in Single column, enter C2.
- Click OK.
Interpret the results
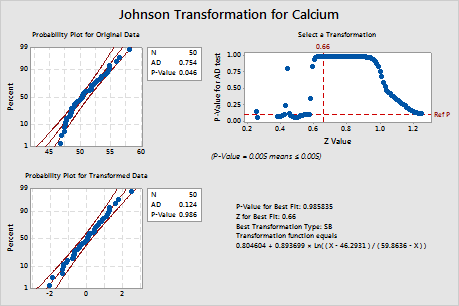
Minitab displays a normal probability plot and a p-value for the original and transformed data. If the data are normal, the points on the plot follow an approximately straight line and the p-value is greater than the alpha level. To evaluate the distribution fit, an alpha level of 0.05 or 0.10 is often used.
For the original data, the data points on the probability plot do not follow a straight line and the p-value (0.046) is less than alpha, which indicates that the original calcium data are not normal. For the transformed data, the data points on the probability plot fall along the straight lineand the p-value (0.986) is greater than alpha. Therefore, you can assume that the transformed calcium data follow a normal distribution.