A quality engineer assesses whether the process used to manufacture light bulbs is in control. The engineer tests 500 light bulbs each hour for three 8-hour shifts and records the number of bulbs that did not light (defectives).
The engineer creates an NP chart to monitor the number of defective light bulbs.
- Open the sample data, DefectiveLightBulbs.MWX.
- Choose .
- In Variables, enter Defectives.
- In Subgroup sizes, enter 500.
- Click NP Chart Options.
- On the Tests tab, select 1 point > K standard deviations from center line (Test 1) and K points in a row on same side of center line (Test 2).If you are not sure which tests apply in your specific situation, use Tests 1 and 2 when you first establish the control limits based on your data.
- Click OK in each dialog box.
Interpret the results
One point is out of control on the NP chart. The engineer concludes that the process is not stable and should be improved.
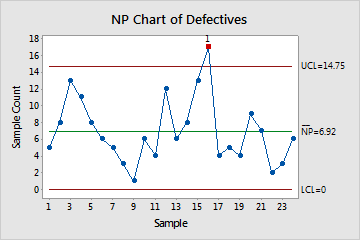
Test Results for NP Chart of Defectives
| TEST 1. One point more than 3.00 standard deviations from center line. |
|---|
| Test Failed at points: 16 |