In This Topic
- PPM < LSL for Expected Between/Within Performance
- PPM > USL for Expected Between/Within Performance
- PPM Total for Expected Between/Within Performance
- % < LSL for Expected Between/Within Performance
- % > USL for Expected Between/Within Performance
- % Total for Expected Between/Within Performance
- Confidence interval (CI), Lower bound (LB), Upper bound (UB) for expected between/within performance
PPM < LSL for Expected Between/Within Performance
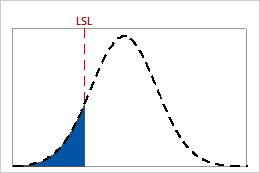
The probability that a randomly selected part is less than LSL is shown by the shaded region under the between/within normal curve.
Interpretation
Use PPM < LSL for expected between/within performance to estimate the number of nonconforming items, represented in parts per million, that you can expect to be below the lower specification limit based on the variation between/within the subgroups. Between/within performance values indicate the performance that could be achieved if additional sources of systemic process variation, besides the variation between and within subgroups, could be eliminated.
Lower values of PPM < LSL indicate greater process capability, relative to the lower specification limit. Ideally, few or no parts have measurements that are less than the lower specification limit.
PPM > USL for Expected Between/Within Performance
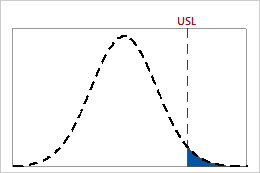
The probability that a randomly selected part is greater than USL is shown by the shaded region under the between/within normal curve.
Interpretation
Use PPM > USL for expected between/within performance to estimate the number of nonconforming items, represented in parts per million, that you can expect to be above the upper specification limit based on the variation between/within the subgroups. Between/within performance values indicate the performance that could be achieved if additional sources of systemic process variation, besides the variation between and within subgroups, could be eliminated.
Lower values of PPM > USL indicate greater process capability, relative to the upper specification limit. Ideally, few or no parts have measurements that are greater than the upper specification limit.
PPM Total for Expected Between/Within Performance
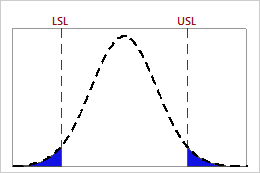
The probability that a randomly selected part is outside the specification limits is shown by the shaded regions under the between/within normal curve.
Interpretation
Use PPM Total for expected between/within performance to estimate the number of nonconforming items, represented in parts per million, that you can expect to be outside the specification limits based on the variation between/within the subgroups. Between/within performance values indicate the performance that could be achieved if additional sources of systemic process variation, besides the variation between and within subgroups, could be eliminated.
Lower values of PPM Total indicate greater process capability. Ideally, few or no parts have measurements that are outside the specification limits.
| PPM | % Nonconforming Parts | % Conforming |
|---|---|---|
| 66807 | 6.6807% | 93.3193% |
| 6210 | 0.621% | 99.379% |
| 233 | 0.0233% | 99.9767% |
| 3.4 | 0.00034% | 99.99966% |
% < LSL for Expected Between/Within Performance
The probability that a randomly selected part is less than LSL is shown by the shaded region under the between/within normal curve.
Interpretation
Use % < LSL for expected between/within performance to estimate the percentage of nonconforming items that you can expect to be below the lower specification limit based on the variation between/within the subgroups. Between/within performance values indicate the performance that could be achieved if additional sources of systemic process variation, besides the variation between and within subgroups, could be eliminated.
Lower values of % < LSL indicate greater process capability, relative to the lower specification limit. Ideally, few or no parts have measurements that are less than the lower specification limit.
% > USL for Expected Between/Within Performance
The probability that a randomly selected part is greater than USL is shown by the shaded region under the between/within normal curve.
Interpretation
Use % > USL for expected between/within performance to estimate the percentage of nonconforming items that you can expect to be above the upper specification limit based on the variation between/within the subgroups. Between/within performance values indicate the performance that could be achieved if additional sources of systemic process variation, besides the variation between and within subgroups, could be eliminated.
Lower values of % > USL indicate greater process capability, relative to the upper specification limit. Ideally, few or no parts have measurements that are greater the upper specification limit.
% Total for Expected Between/Within Performance
The probability that a randomly selected part is outside the specification limit is shown by the shaded regions under the between/within normal curve.
Interpretation
Use % Total for expected between/within performance to estimate the percentage of nonconforming items, that you can expect to be outside the specification limits based on the variation between/within the subgroups. Between/within performance values indicate the performance that could be achieved if additional sources of systemic process variation, besides the variation between and within subgroups, could be eliminated.
Lower values of % Total indicate greater process capability. Ideally, few or no parts have measurements that are outside the specification limits.
Confidence interval (CI), Lower bound (LB), Upper bound (UB) for expected between/within performance
The confidence interval is a range of likely values for a performance measure. The confidence interval is defined by a lower bound and an upper bound. The bounds are calculated by determining a margin of error for the sample estimate. The lower confidence bound defines a value that the performance measure is likely to be greater than. The upper confidence bound defines a value that the performance measure is likely to be less than.
Note
To display confidence intervals, you must click Options and select Include confidence intervals when you perform the capability analysis. Minitab displays a confidence interval or a confidence bound for the capability indices and the performance measures. Minitab displays separate statistics for the between/within-subgroup variation and the overall variation.
Interpretation
Because samples of data are random, different samples collected from your process are unlikely to yield identical estimates of a performance measure. To calculate the actual value of the performance measure for your process, you would need to analyze data for all the items that the process produces, which is not feasible. Instead, you can use a confidence interval to determine a range of likely values for the performance measure.
At a 95% confidence level, you can be 95% confident that the actual value of the performance measure is contained within the confidence interval. That is, if you collect 100 random samples from your process, you can expect approximately 95 of the samples to produce intervals that contain the actual value of the performance measure.
The confidence interval helps you to assess the practical significance of your sample estimate. When possible, compare the confidence bounds with a benchmark value that is based on process knowledge or industry standards.
For example, a company uses a minimum benchmark value of 0.3% for the % Total out of specification to define a capable process. Using capability analysis, they obtain a % total out of specification estimate of 0.146%, which suggests that the process is capable. To further assess this estimate, they display a 95% upper confidence bound for the % Total out of specification. If the 95% upper confidence bound is less than 0.3%, they can be extremely confident that their process is capable, even when taking into account the variability from random sampling that affects the estimate.