Use the triangular distribution to describe a population for which limited sample data are available. For example, in the oil industry, data are expensive to collect and modeling the population is almost impossible.
The triangular distribution is commonly used to model business risk and stochastic processes. For example, collecting data for the construction cost of a new building is difficult. However, you can estimate the minimum, maximum, and most likely (mode) construction costs. These values are easy to define and explain and are a reasonable representation of the data.
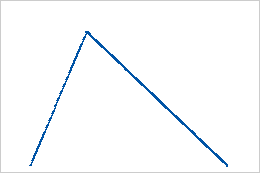
A triangular distribution is a continuous distribution that is described by its minimum, maximum, and mode values. The distribution has a triangular form. It starts at the minimum value, increases linearly to peak at the mode, and then decreases linearly to the maximum value. The shape of the triangle can be symmetrical or asymmetrical. For example, the following graph illustrates a triangular distribution with parameters minimum = 10, mode = 50, and maximum = 150.