The largest extreme value distribution and the smallest extreme value distribution are closely related. For example if X has a largest extreme value distribution, then −X has a smallest extreme value distribution, and vice versa.
Smallest extreme value distribution
The smallest extreme value distribution is defined by its location and scale parameters. Use the smallest extreme value distribution to model the minimum value from a distribution of random observations. The smallest extreme value distribution is commonly used to model time to failure for a system that fails when its weakest component fails. The smallest extreme value distribution describes extreme phenomena such as the minimum temperature and rainfall during a drought. The smallest extreme value distribution is skewed to the left. For example, the distribution of the breaking strength of a chain is frequently skewed to the left, because the chain breaks when the weakest link breaks. This distribution has a few weak samples to the left and a majority of strengths in the upper tail. 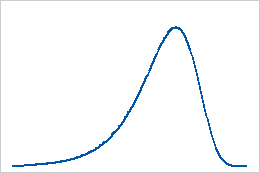
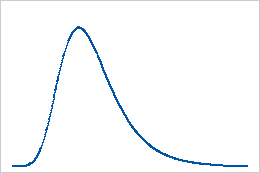
Largest extreme value distribution
The largest extreme value distribution is defined by its location and scale parameters. Use the largest extreme value distribution to model the maximum value from a distribution of random observations. The largest extreme value distribution describes extreme phenomena such as extreme wind velocities and high insurance losses. The largest extreme value distribution is skewed to the right. For example, the distribution of the water levels in a river over time is frequently skewed to the right with a few cases of extreme water levels to the right and a majority of water levels in the lower tail.