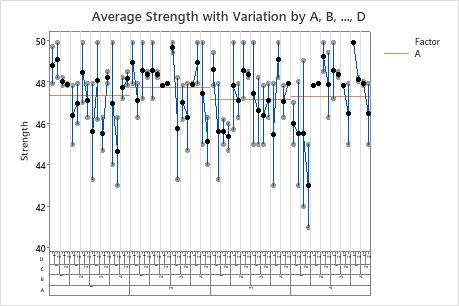
Mean lines on the measurement variation chart show the overall mean
and the factor means. The mean line on the standard deviation chart shows the
mean of the standard deviations.
In This Topic
About mean lines
Mean lines provide points of reference on your graph. The overall mean line displays by default on the measurement variation chart. You can add or remove horizontal lines with different colors to represent the factor means. If you add the standard deviation chart, the mean of the standard deviations displays by default.
Mean line for factor A

Mean line for factor B

Mean line for factor A and B
Add a line
You can add an overall mean line or factor mean lines to the measurement variation chart. You can also add a mean of standard deviation line to the standard deviation chart.
- Double-click the graph.
- From Add Item, select Data Display.
- Choose the lines that you want to add.
Delete a line
You can delete mean lines while editing the graph.
- Double-click the graph.
- Select the mean line and delete it.
Edit a line
You can edit a line by changing the line type, line color or line size.
- Double-click the graph.
- Double-click the line that you want to edit.
- Choose Custom and then make your edits.