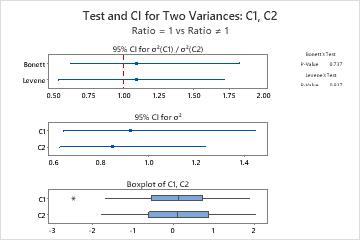
- Summary plot
- Use a summary plot to display a summary of the results. The summary plot includes confidence intervals for the ratio of the standard deviations or variances and p-values for the tests. The summary plot also includes a confidence interval for the standard deviation or variance of each sample and boxplots of each sample.
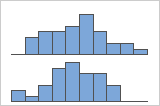
- Histogram
- Use a histogram to assess the shape and spread of the data.
Histograms are best when the sample size is greater than 20.
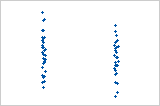
- Individual value plot
- Use an individual value plot to examine the spread of the data and to identify any potential
outliers.
Individual value plots are best when the sample size is less than 50.