Select the method or formula of your choice.
CUSUM plan, h, k, and FIR
With in-control processes, CUSUM charts are good at detecting small shifts away from the target, because they incorporate information from the sequence of sample values. The plotted points are the cumulative sums of the deviations of the sample values from the target. These points should fluctuate randomly around zero. If a trend develops upwards or downwards, it should be considered as evidence that the process mean has shifted, and you should look for special causes.
- Tabular CUSUM (the default)
- The upper CUSUM detects upward shifts in the level of the process and the lower CUSUM detects downward shifts. This chart uses control limits (UCL and LCL) to determine when an out-of-control situation has occurred. See Prins et al.1 and Stoumbos et al.2 for a discussion of tabular CUSUMs.
- V-mask CUSUM
- This chart uses a V-mask, rather than control limits, to determine when an out-of-control situation has occurred. See Lucas3 and Wadsworth et al.4 for a discussion of the V-mask chart.
CUSUM charts are defined by two parameters, h and k, which are often referred to as the CUSUM plan. These values are often selected from ARL (Average Run Length) tables. See Lucas3 and Lucas et al.5.
h
For tabular CUSUMs, h is the number of standard deviations between the center line and the control limits. It is the value at which an out-of-control signal occurs.
For V-mask CUSUMs, Minitab calculates the half-width of the V-mask (H) at the point of origination by H = hσ.
The default value for h is 4.
k
For tabular CUSUMs, k is the allowable "slack" in the process. In the CUSUM point formula, k specifies the size of the shift you want to detect.
For V-mask CUSUMs, k is the slope of the V-mask arms. You can select k using an ARL table.
The default value for k is 0.5.
FIR
FIR (fast initial response) is a method used to initialize the tabular CUSUM. Normally, tabular CUSUMs are initialized at 0, but if the process is out of control at startup, the CUSUMs will not detect the situation for several subgroups.Tabular CUSUM
Plotted points
The data plotted in a CUSUM chart are CLi, CUi.
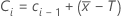
The value of a lower tabular CUSUM at time i:

where:

The value of an upper tabular CUSUM at time i:

where:

Center line
For the default, tabular CUSUM chart, the center line is 0.
Lower control limit (LCL)

Upper control limit (UCL)

Notation
| Term | Description |
|---|---|
 | subgroup mean |
| T | target |
| k | size of the shift you want to detect |
| σ | process standard deviation |
| m | subgroup size |
| f | FIR |
| h | decision interval |
V-mask CUSUM
Plotted points
Ci, the value of a V-mask CUSUM at time i =
where C0 = 0
V-mask slope

V-mask width at origin

V-mask origin
The default chart uses n to estimate the origin p.
Notation
| Term | Description |
|---|---|
| T | target |
| k | slope of the V-mask arm |
| h | decision interval |
| m | subgroup size |
Methods and formulas for Box-Cox
Box-Cox formula
If you use a Box-Cox transformation, Minitab transforms the original data values (Yi) according to the following formula:
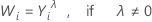
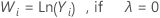
where λ is the parameter for the transformation. Minitab then creates a control chart of the transformed data values (Wi). To learn how Minitab chooses the optimal value for λ, go to Methods and formulas for Box-Cox Transformation.
Common λ values
| λ | Transformation |
|---|---|
| 2 |  |
| 0.5 |  |
| 0 |  |
| −0.5 |  |
| −1 |  |