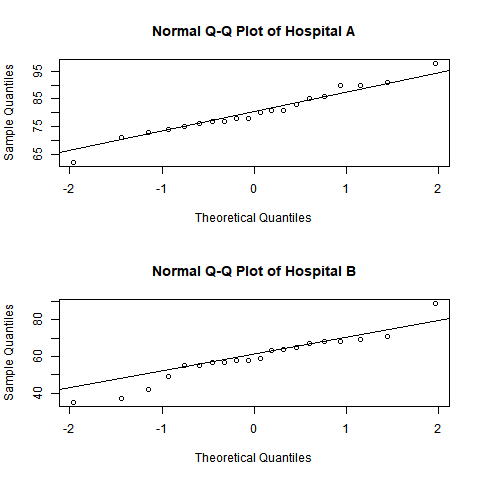
一位医疗保健顾问希望使用分位数-分位数 (QQ) 图比较两家医院患者满意度评级的正态性。QQ 图显示了每组患者满意度评级对正态分布的拟合优度。
R 脚本示例从 Minitab 中的列读取数据。该脚本计算分位数,并为每列创建一个 QQ 图。然后,脚本将图发送到 Minitab“输出”窗格。
以下 .ZIP 文件提供了本指南中引用的所有文件:r_guide_files.zip。
使用以下文件执行本节中的步骤:
| 文件 | 说明 |
|---|---|
| qq_plot.R | R 脚本,用于从 Minitab 工作表中获取列并显示每个列的 QQ 图。 |
以下示例中的 R 脚本需要以下 R 包:
- mtbr
- 集成 Minitab 和 R 的 R 包。在该示例中,此模块中的函数将 R 结果发送到 Minitab。
- 确保已安装所需模块:mtbr。
- 要安装 mtbr 包,在 R 终端中运行以下命令:
install.packages("url-to-mtbr")
- 要安装 mtbr 包,在 R 终端中运行以下命令:
- 将 R 脚本文件 qq_plot.R 保存到 Minitab 默认文件位置。 有关 Minitab 在何处查找 R 脚本文件的更多信息,请转到 Minitab 的 R 文件的默认文件夹。
- 打开样本数据集酒店比较未堆叠.MWX。
- 在 Minitab 命令行窗格中,输入
RSCR "qq_plot.R" "Hospital A" "Hospital B"。 - 单击运行。
qq_plot.R
require(mtbr, quietly=TRUE) column_names <- commandArgs(trailingOnly = TRUE) if (length(column_names) == 0) { current_index <- 1 while (length(mtbr::mtb_get_column(paste0("C",current_index))) > 0) { column_names[current_index] <- paste0("C", current_index) current_index <- current_index + 1 } } if (length(column_names) == 0 || length(mtbr::mtb_get_column(column_names[1])) == 0) { stop("Worksheet is empty or column data could not be found!\n\tPass columns to RSCR or move first column to C1.") } png("qqplot.png") par(mfrow=c(ceiling(length(column_names)/round(sqrt(length(column_names)))), round(sqrt(length(column_names))))) for (column_name in column_names) { column <- mtbr::mtb_get_column(column_name) qqnorm(column, main=paste0("Normal Q-Q Plot of ", column_name)) qqline(column) } graphics.off() mtbr::mtb_add_image("qqplot.png")结果
R Script

