一家家具生产厂的材料工程师想要评估该制造厂所使用的刨花板的硬度。工程师测量刨花板片样本的硬度和密度。
工程师使用简单回归确定刨花板的密度是否与刨花板的硬度相关联。
- 打开样本数据 刨花板.MWX。
- 选择。
- 在 响应中,输入硬度。
- 在 预测变量中,输入密度。
- 在回归模型类型下,选择二次。
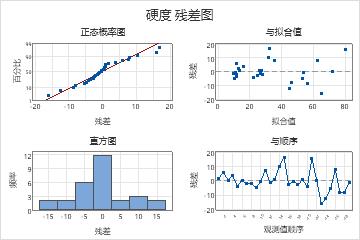
- 单击图形。在残差图下,选择四合一。单击确定。
- 单击选项。在显示选项下,选择显示置信区间和显示预测区间。
- 在每个对话框中单击确定。
解释结果
In the Analysis of Variance table, the p-value for the regression model is 0.000, which means that the actual p-value is less than 0.0005. Because the p-value is less than the significance level of 0.05, the engineer can conclude that the association between stiffness and density is statistically significant. In the Sequential Analysis of Variance table, the p-value for the linear term, Density is 0.000 and for the quadratic term, Density2 is 0.003. 这两个 p 值都小于显著性水平 0.05。
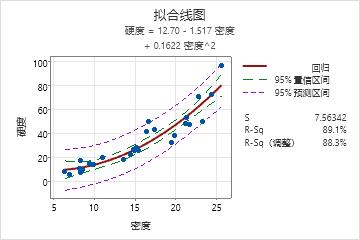
但是,拟合线图的右上角似乎存在一个异常值。由于该异常值对结果有较强的效应,因此工程师应当研究该点以确定原因。
回归方程为
硬度 = 12.70 - 1.517 密度 + 0.1622 密度^2
硬度 = 12.70 - 1.517 密度 + 0.1622 密度^2
模型汇总
| S | R-sq | R-sq(调整) |
|---|---|---|
| 7.56342 | 89.13% | 88.29% |
方差分析
| 来源 | 自由度 | SS | MS | F | P |
|---|---|---|---|---|---|
| 回归 | 2 | 12189.4 | 6094.70 | 106.54 | 0.000 |
| 误差 | 26 | 1487.3 | 57.21 | ||
| 合计 | 28 | 13676.7 |
方差的序贯分析
| 来源 | 自由度 | SS | F | P |
|---|---|---|---|---|
| 线性 | 1 | 11552.8 | 146.86 | 0.000 |
| 二次 | 1 | 636.6 | 11.13 | 0.003 |