A financial analyst investigates the factors that are associated with the probability that a college student has certain credit cards. The analyst randomly samples college students for a survey. The survey asks the students questions about their education and finances.
For marketing purposes, the analyst wants to identify predictor values that are associated with the population of students who have a low probability of having a MasterCard and a high probability of having an American Express credit card. The analyst fits binary logistic regression models for both American Express and MasterCard to determine how the predictors are associated with the probability of having each of these credit cards.
After fitting the models, the analyst uses Response Optimizer to find predictor settings that produce acceptable probabilities for both credit cards.
- Open the sample data, CreditSurvey.MTW.
- Choose .
- In the MasterCard row, in Goal, select Minimize.
- In the American Express row, in Goal, select Maximize.
- Click OK.
Interpret the results
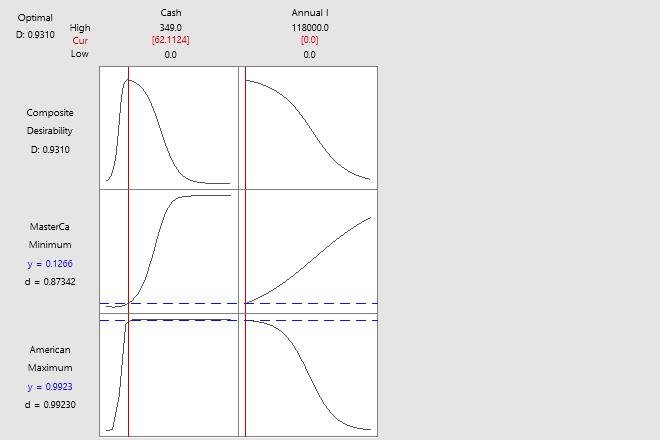
Minitab uses the two stored models to estimate the predictor settings that optimize the values of both response variables. The combined desirability (also called composite desirability) of these two responses is 0.9310, which indicates an excellent but not perfect solution.
The predictor settings shown in the graph are associated with students who have a low probability of possessing a MasterCard credit card but a high probability of possessing an American Express card. This population of students has an average of $62.11 cash and no annual income. The output indicates that the fitted probabilities for these values are 0.127 for Master Card and 0.9923 for American Express. The confidence intervals indicate the precision of these predictions.
You can adjust the variable settings of this initial solution directly on the plot. Move the vertical bars to change the factor settings and see how the individual desirability (d) of the responses and the composite desirability change.
Parameters
| Response | Goal | Lower | Target | Upper | Weight | Importance |
|---|---|---|---|---|---|---|
| MasterCard | Minimum | 0 | 1 | 1 | 1 | |
| American Express | Maximum | 0 | 1 | 1 | 1 |
Solution
| Solution | Cash | Annual Income | MasterCard Fitted Probability | American Express Fitted Probability | Composite Desirability |
|---|---|---|---|---|---|
| 1 | 62.1124 | 0 | 0.126577 | 0.992297 | 0.930964 |
Multiple Response Prediction
| Variable | Setting |
|---|---|
| Cash | 62.1124 |
| Annual Income | 0 |
| Response | Fitted Probability | SE Fit | 95% CI |
|---|---|---|---|
| MasterCard | 0.127 | 0.172 | (0.007, 0.754) |
| American Express | 0.9923 | 0.0322 | (0.0323, 1.0000) |