A gage linearity and bias study determines whether your gage is measuring accurately. The study assesses linearity (how accurate your measurements are through the expected range of measurements) and bias (how well your measurements compare to a reference value).
When you conduct a gage linearity and bias study, Minitab displays a graph of the best fitted line of the biases across the reference values.
In the linearity section of the output, Minitab shows how consistently the gage measures across the reference values. When the slope is small, the gage linearity is good.
Bias indicates how close your measurements are to the reference values. A positive bias indicates that the gage overestimates. A negative bias indicates that the gage underestimates. The %Bias value indicates the magnitude of the bias as a percent of the process variation (usually 6 sigma).
If the gage measures low at small reference values and high at large reference values, there may be a statistically significant slope (the p-value for slope shows the significance), which indicates large linearity. In this situation, the bias values are positive at one extreme and negative at the other, making the overall bias impractical to interpret.
Example of a gage linearity and bias study
An engineer works for a company that manufactures several types of screws that have different diameters. The engineer wants to know whether bias is present in the measurement system, and whether this bias is constant, independent of the outer diameter of the screw.
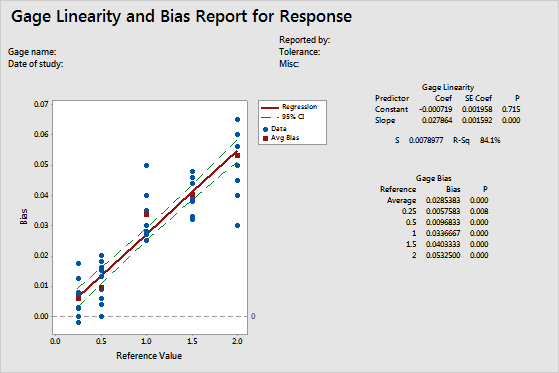
The engineer selects 5 screw sizes (0.25", 0.5", 1.0", 1.5", and 2.0") and an operator measures the outer diameter of each screw 12 times.
In all screw sizes, bias is present and significant (the p-value is less than 0.05 for all the reference sizes). For example, for the 0.25" screw, the average bias is 0.0057583. So, on average, the diameter measurements are higher than the reference value. The bias increases with the screw diameter, as identified by the positively sloped line in the scatterplot. The inconsistency of the bias across the sizes indicates that the measurement system also has linearity problems (p = 0.00).