Use I-MR-R/S
Chart to monitor the mean of your process and the variation between and within subgroups when each subgroup is a different part or batch. Use this control chart to monitor process stability over time so that you can identify and correct instabilities in a process.
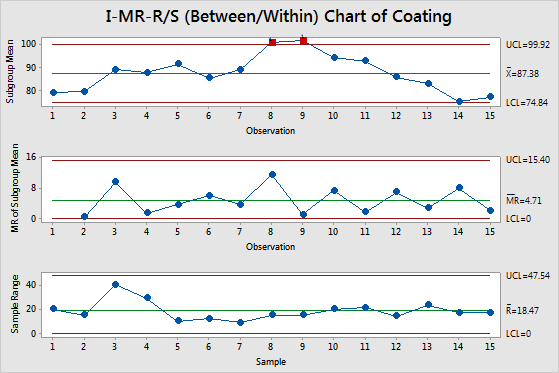
A manufacturer of steel beams coats each beam with an anti-corrosion treatment. Engineers measure the thickness of the coating at 3 positions on 15 beams. Because the engineers want to monitor the variation in the coating thickness both within a single beam and across all beams, they use an I-MR-R/S chart.
This chart shows that the coating process is not stable, as indicated by the out-of-control points on the I chart (the first chart shown in the graph).
Where to find this control chart
To create an I-MR-R/S chart, choose Stat > Control Charts > Variables Charts for Subgroups > I-MR-R/S (Between/Within).
When to use an alternate control chart
If your data are counts of defectives or defects, use an attribute control chart, such as P Chart or U Chart.