Use T Chart to monitor the time between rare events, such as infections or surgical complications. When you monitor rare events with a traditional chart, such as a P or a U chart, you need a large amount of data to establish accurate control limits. Therefore, collecting enough rare event data to detect an adverse change in the frequency of events may take months or even years. With a T chart, you do not need to collect large amounts of data to detect special causes in rare events.
For example, a hospital wants to monitor the number of patient falls. Hospital staff record the date and time of each fall. Because this data is rare event data, the hospital staff use a T chart to track the rate of errors. 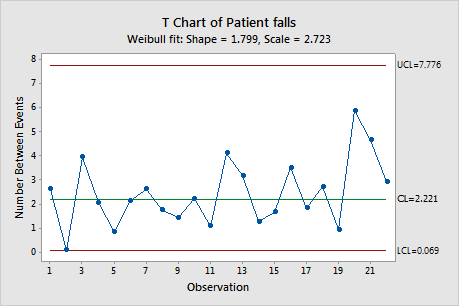
Where to find this control chart
To create a T chart, choose .
When to use an alternate control chart
If your data are the dates of each rare event but not the specific time for each event, use G Chart.