Use Scatterplot to investigate the relationship between a pair of continuous variables. A scatterplot displays ordered pairs of x and y variables in a coordinate plane.
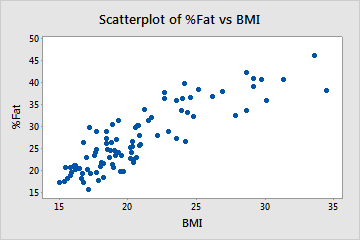
For example, a medical researcher creates a scatterplot to show the positive relationship between Body Mass Index (BMI) and body fat percentage in adolescent girls.

Where to find this graph
To create a scatterplot, choose .
When to use an alternate graph
If you want to plot data over time and the data were collected in chronological order at regular intervals, you can use a Time Series Plot.
