About graph annotation
- Text
- Rectangles and squares
- Circles and ellipses
- Marker symbols
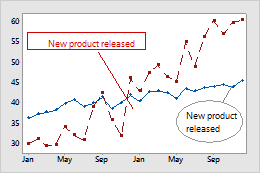
Times series plot of sales trends
This graph includes a rectangle, an ellipse, text, and lines.
Add annotation to graphs
Use the Graph Annotation Tools toolbar to add annotation items to graphs.
Graph Annotation Tools toolbar
- Double-click the graph.
- Click the item on the Graph Annotation Tools toolbar.
- Click and drag on the graph to place and size the item.
Edit annotation on a graph
You can change things like the color and size of annotations.
- Double-click the graph.
- Double-click the annotation.
The edits that you can make depend on the type of annotation. For example, for some annotations you can change attributes and units:
- Change attributes
-
For a shape, you can change the fill pattern, borders, and fill lines. For an annotation line, you can change the line type, line color, line size, and specify an arrow style.
- Change units
-
Minitab tracks the location of annotations using a coordinate system. The coordinates can be in data units, which are relative to the graph scales, or figure units, which are relative to the figure region. (Usually, the figure region covers the entire graph.) For example, if you use data units (which is the default), then the annotation adjusts when you change the data region or scale. To change the units, double-click the annotation, then on the Units tab, select Switch coordinate system from data units to figure units.
Copy or duplicate annotation
You can copy the text from an annotation to a new graph. You can copy other annotations only to a different location on the same graph.
- Double-click the graph.
-
Select the annotation to copy, then do either of the following:
- To duplicate any annotation in the same graph, on the toolbar choose .
- To copy a text annotation to a new graph, on the toolbar press the Copy Text button. Then, open the new graph for editing and paste the text by pressing CTRL + V.
Reposition an annotation
You can move annotations backwards or forwards relative to each other. You can also rotate annotations.
- Double-click the graph.
-
On the toolbar, click
Annotation,
then select one of the following items:
- Bring to Front or Send to Back
- Rotate Left or Rotate Right