About bins
Change the number of bins
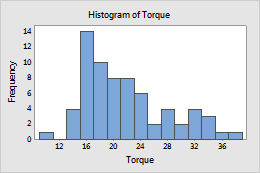
The number of bins affects the appearance of a graph. If there too few bins, the graph will be unrefined and will not represent the data well. If there are too many bins, many of the bins will be unoccupied and the graph may have too much detail.
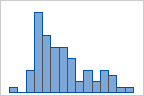
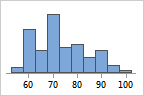
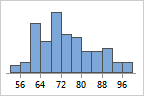
For example, the following histograms represent the same data with different numbers of bins. Minitab automatically calculates and uses an optimal number of bins. The middle graph (15 bins) is the Minitab default for these data.
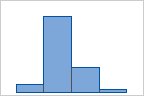
4 bins
15 bins
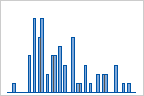
50 bins
- Double-click the graph.
- Double-click a bar on a histogram or a dot on a dotplot.
- On the Binning tab, under Interval Definition, choose Number of intervals, and enter the number of bins.
Change the bin definition method
Bins can be defined by either their midpoints (center values) or their cutpoints (boundaries). The appearance of the graph changes if you change the bin definition method.
For example, for a histogram of scores in a wine tasting competition, you want your bins to correspond to categories (90-100 outstanding, 80-90 good, 70-80 average, and so on). You would choose to define bins by specified cutpoints. If you want bins to be defined by their centers, you would use midpoints.
- Double-click the graph.
- Double-click a bar on a histogram or a dot on a dotplot.
-
On the
Binning
tab, under
Interval Type,
choose one of the following options:
Midpoint
Cutpoint
- (Optional) To specify the positions, under Interval Definition, choose Midpoint/Cutpoint positions and enter the positions.