Graph > Bar Chart > Counts of unique values > Simple
In Categorical variables, enter one or more columns of categorical data that you want to graph. By default, Minitab creates a separate graph for each variable.
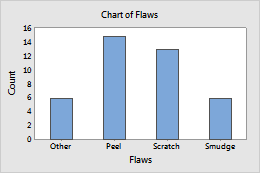
In this worksheet, Flaws is the categorical variable. The graph shows the counts of each flaw type.