Choose , then select a 3D surface plot based on how you want the plot to look.
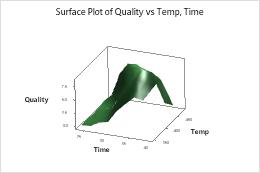
- Surface
- Create a 3D surface plot that displays predictor variables on the x-axis and y-axis a three-dimensional smooth surface for the response variable. For example, the following 3D surface plot shows the relationship between quality, time, and temperature.
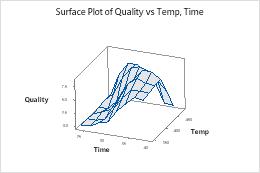
- Wireframe
-
Create a 3D surface plot that displays predictor variables on the x-axis and y-axis a three-dimensional wireframe surface for the response variable. For example, the following wireframe plot shows the relationship between quality, time, and temperature.
For more information, go to Create a 3D surface plot.