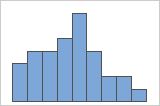
- Histogram of differences
- Use a histogram to assess the shape and spread of the data. Histograms are best when the sample size is greater than 20.
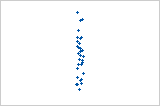
- Individual value plot of differences
- Use an individual value plot to examine the spread of the data and to identify any potential outliers. Individual value plots are best when the sample size is less than 50.
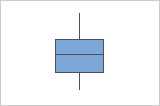
- Boxplot of differences
- Use a boxplot to examine the spread of the data and to identify any potential outliers. Boxplots are best when the sample size is greater than 20.