In This Topic
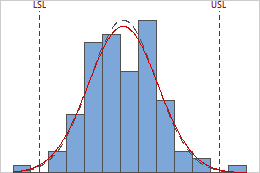
LSL
The lower specification limit (LSL) of the process is the minimum allowed value for the product or service. This limit does not indicate how the process is performing but how you want it to perform. You specify LSL when you set up the capability analysis.
Note
If you use a data transformation when you perform the capability analysis, Minitab also calculates LSL*, which is the lower specification limit for the transformed data.
Interpretation
Use the USL and LSL to define customer requirements and to evaluate whether your process produces items that meet the requirements.
The upper and lower specification limits are identified by the vertical dashed lines on the histogram. Compare the histogram bars to the lines to assess whether the measurements are within the specification limits.
The specification spread is the distance between the upper specification limit and the lower specification limit (USL – LSL). Suppose a company produces ball point pens and the target outer diameter for the ball is 0.35 mm. The acceptable range for ball outer diameters is 0.34 to 0.36 mm. Therefore, the LSL is 0.34, the USL is 0.36, and the specification spread is 0.02 mm.
Minitab compares the specification spread to the process spread to determine your process capability.
Target
The target is the ideal value of a process based on your customer requirements. For example, if a cylindrical part produces optimal performance in a product when the diameter is 32 mm, then 32 mm is the target for this part.
Note
If you use a data transformation when you perform the capability analysis, Minitab also calculates Target*, which is the process target for the transformed data.
Interpretation
Use the target to define optimal process performance and to compare with the mean of your process.
The target value is usually, but not always, centered between the lower and upper specification limits. When you have a target, examine whether your process is centered near the target.
Minitab uses the target to calculate Cpm, which describes the capability of your process relative to the target and the specification limits.
USL
The upper specification limit (USL) of the process is the maximum allowed value for the product or service. This limit does not indicate how the process is performing but how you want it to perform. You specify USL when you set up the capability analysis.
Note
If you use a data transformation when you perform the capability analysis, Minitab also calculates USL*, which is the upper specification limit for the transformed data.
Interpretation
Use the USL and LSL to define customer requirements and to evaluate whether your process produces items that meet the requirements.
The upper and lower specification limits are identified by the vertical dashed lines on the histogram. Compare the histogram bars to the lines to assess whether the measurements are within the specification limits.
The specification spread is the distance between the upper specification limit and the lower specification limit (USL – LSL). Suppose a company produces ball point pens and the target outer diameter for the ball is 0.35 mm. The acceptable range for ball outer diameters is 0.34 to 0.36 mm. Therefore, the LSL is 0.34, the USL is 0.36, and the specification spread is 0.02 mm.
Minitab compares the specification spread to the process spread to determine your process capability.
Sample Mean
The sample mean is either the average of the sample measurements, or the historical process mean that you specify for the analysis.
Note
If you use a data transformation when you perform the capability analysis, Minitab also calculates Sample Mean*, which is the sample mean of the transformed data.
Interpretation
Use the sample mean to estimate where the process is centered.
If the data are normal, the mean occurs at the peak of the distribution curve. If the data do not follow a symmetric, bell-shaped distribution, the mean may not occur at the peak of the distribution curve. Outliers can also strongly affect the value of the mean. If your data are not normally distributed or if your data contain outliers, you may want to transform your data or use a nonnormal distribution.
Minitab uses the sample mean to calculate the capability indices.
Sample N
The sample size (N) is the total number of observations in your data. For example, if you collected 20 subgroups of size 5, your sample N is 100.
Interpretation
Use N to assess your sample size.
Generally, larger sample sizes produce more reliable estimates of process capability. Some experts recommend at least 100 total observations for a capability analysis.
StDev (Overall)
Overall standard deviation is the standard deviation of all the measurements and is an estimate of the overall variation of the process. If your data are collected properly, the overall standard deviation captures all sources of systemic variation. In that case, it represents the actual variation of the process that the customer experiences over time.
Note
If you use a data transformation when you perform the capability analysis, Minitab also calculates StDev(Overall)*, the overall standard deviation of the transformed data.
Interpretation
Compare the within-subgroup standard deviation with the overall standard deviation. A substantial difference between the within-subgroup standard deviation and the overall standard deviation may indicate that the process is not stable, or that your process has other sources of variation in addition to the variation within subgroups. Use a control chart to verify that your process is stable before you perform a capability analysis.
Minitab uses the overall standard deviation to calculate Pp, Ppk, and other measures of the overall capability of your process.
StDev (Within)
Within standard deviation is an estimate of the variation within the subgroups. If your data are collected properly, the within-subgroup variation should not be influenced by changes to process inputs, such as tool wear or different lots of material. In that case, the within standard deviation represents the natural and inherent variation of the process over a short period of time. It indicates the potential variation of the process if shifts and drifts between subgroups were eliminated.
Note
If you use a data transformation when you perform the capability analysis, Minitab also calculates StDev(Within)*, the within-subgroup standard deviation of the transformed data.
Interpretation
Compare the within-subgroup standard deviation with the overall standard deviation. A substantial difference between the within-subgroup standard deviation and the overall standard deviation may indicate that the process is not stable, or that your process has other sources of variation in addition to the variation within subgroups. Use a control chart to verify that your process is stable before you perform a capability analysis.
Minitab uses the within-subgroup standard deviation to calculate Cp, Cpk, and other measures of the potential capability of your process.