LSL
The lower specification limit (LSL) of the process is the minimum allowed value for the product or service. This limit does not indicate how the process is performing but how you want it to perform. You specify LSL when you set up the capability analysis.
Note
If you use a data transformation when you perform the capability analysis, Minitab also calculates LSL*, which is the lower specification limit for the transformed data.
Interpretation
Use the USL and LSL to define customer requirements and to evaluate whether your process produces items that meet the requirements.
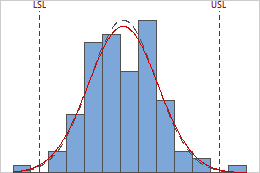
The upper and lower specification limits are identified by the vertical dashed lines on the histogram. Compare the histogram bars to the lines to assess whether the measurements are within the specification limits.
The specification spread is the distance between the upper specification limit and the lower specification limit (USL – LSL). Suppose a company produces ball point pens and the target outer diameter for the ball is 0.35 mm. The acceptable range for ball outer diameters is 0.34 to 0.36 mm. Therefore, the LSL is 0.34, the USL is 0.36, and the specification spread is 0.02 mm.
Minitab compares the specification spread to the process spread to determine your process capability.
Target
The target is the ideal value of a process based on your customer requirements. For example, if a cylindrical part produces optimal performance in a product when the diameter is 32 mm, then 32 mm is the target for this part.
Interpretation
Use the target to define customer requirements and to compare with your observations.
The target value is usually, but not always, centered between the lower and upper specification limits. When you have a target, examine whether your process is centered near the target.
USL
The upper specification limit (USL) of the process is the maximum allowed value for the product or service. This limit does not indicate how the process is performing but how you want it to perform. You specify USL when you set up the capability analysis.
Note
If you use a data transformation when you perform the capability analysis, Minitab also calculates USL*, which is the upper specification limit for the transformed data.
Interpretation
Use the USL and LSL to define customer requirements and to evaluate whether your process produces items that meet the requirements.
The upper and lower specification limits are identified by the vertical dashed lines on the histogram. Compare the histogram bars to the lines to assess whether the measurements are within the specification limits.
The specification spread is the distance between the upper specification limit and the lower specification limit (USL – LSL). Suppose a company produces ball point pens and the target outer diameter for the ball is 0.35 mm. The acceptable range for ball outer diameters is 0.34 to 0.36 mm. Therefore, the LSL is 0.34, the USL is 0.36, and the specification spread is 0.02 mm.
Minitab compares the specification spread to the process spread to determine your process capability.
Sample Mean
The sample mean is either the average of the sample measurements, or the historical process mean that you specify for the analysis.
Interpretation
Use the sample mean to estimate the average value of your process.
Because your data are nonnormal and may not follow a symmetric, bell-shaped distribution, the sample mean may not occur at the peak of the distribution.
Sample N
The sample size (N) is the total number of observations in your data. For example, if you collected 20 subgroups of size 5, your sample N is 100.
Interpretation
Use N to assess your sample size.
Generally, larger sample sizes produce more reliable estimates of process capability. Some experts recommend at least 100 total observations for a capability analysis.
Shape
The shape parameter of a distribution determines the shape of distribution function. The shape is either estimated from the data or specified based on historical process knowledge.
Interpretation
The shape parameter for a given distribution can affect how symmetric or skewed the data are.
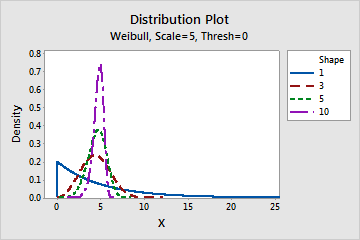
Effect of the shape parameter for a Weibull distribution
This graph shows the effect of the different values of the shape parameter on the Weibull distribution.
Scale
The scale parameter of a distribution determines the scale of the distribution function. The scale is either estimated from the data or specified based on historical process knowledge.
Interpretation
The scale parameter can affect how spread out the data are. Generally, a larger scale value can cause the distribution to appear more horizontally stretched out. A smaller scale value can cause the distribution to appear more horizontally compressed.
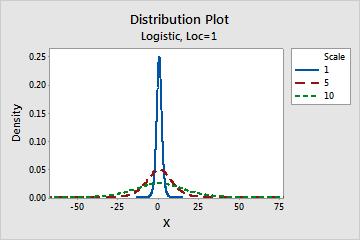
Effect of the scale parameter for a logistic distribution
This graph shows the effect of the different values of the scale parameter on the logistic distribution.
Threshold
The threshold parameter provides an estimate of the minimum value of a random variable. The threshold is either estimated from the data or specified based on historical process knowledge.
Interpretation
The threshold parameter defines the location of the minimum value that is theoretically possible for data from a distribution.
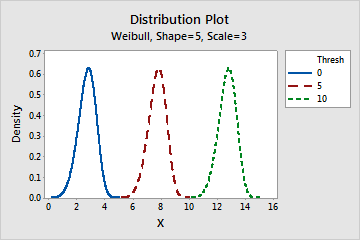
Effect of the threshold parameter for a Weibull distribution
This graph shows the effect of the different values of the threshold parameter on the Weibull distribution.
Location
The location parameter affects the location of a distribution. The location is either estimated from the data or specified based on historical process knowledge.
Interpretation
The location parameter can affect the location of the data by shifting it along the x-axis. A positive location value shifts a distribution to the right, while a negative location value shifts a distribution to the left.
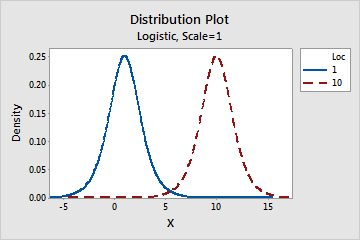
Effect of the location parameter for a logistic distribution
This graph shows the effect of the different values of the location parameter on the logistic distribution.
Mean
If you use the exponential distribution to model your nonnormal data, Minitab reports mean parameter of the distribution.
Interpretation
The mean parameter defines the central value of the data distribution. In an exponential distribution, the mean equals the scale parameter when the threshold parameter is 0.