A quality control engineer needs to ensure that the caps on shampoo bottles are fastened correctly. If the caps are fastened too loosely, they may fall off during shipping. If they are fastened too tightly, they may be too difficult to remove. The target torque value for fastening the caps is 18. The engineer collects a random sample of 68 bottles and tests the amount of torque that is needed to remove the caps.
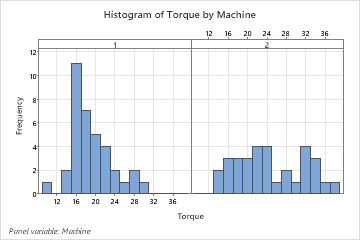
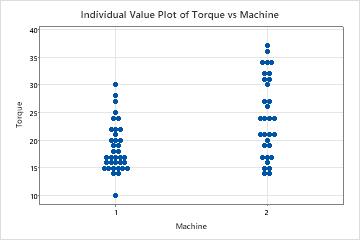
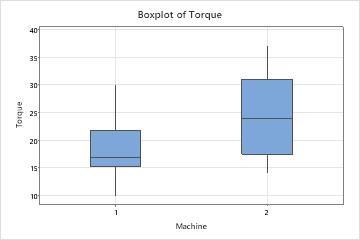
As part of the initial investigation, the engineer analyzes the descriptive statistics of the torque measurements to assess the distribution of the data from each machine.
- Open the sample data, CapTorque.MTW.
- Choose .
- In Variables, enter Torque.
- In By variables (optional), enter Machine.
- Click the Graphs button, and then select Histogram of data, Individual value plot, and Boxplot of data.
- Click OK in each dialog box.
Interpret the results
The mean torque value for Machine 1 is closer to the target of 18 than the mean torque value for Machine 2. The mean torque required to remove caps from Machine 1 is 18.667, and the mean torque required to remove caps from Machine 2 is 24.19. The distribution of data from Machine 1 also is less variable. The standard deviation is 4.395 for Machine 1 and is 7.12 for Machine 2.
The graphs also show that there is a difference in the mean torque values for the two machines. To determine whether a significant difference in population means exists, the engineer could do a 2-sample t-test.
Statistics
| Variable | Machine | N | N* | Mean | SE Mean | StDev | Minimum | Q1 | Median | Q3 | Maximum |
|---|---|---|---|---|---|---|---|---|---|---|---|
| Torque | 1 | 36 | 0 | 18.6667 | 0.732467 | 4.39480 | 10 | 15.25 | 17 | 21.75 | 30 |
| 2 | 32 | 0 | 24.1875 | 1.25839 | 7.11852 | 14 | 17.5 | 24 | 31 | 37 |