Compare the values for each series across the multiple variables. If the variables have a common target value, use the plot to help determine which series best satisfies the goals for the most variables. A common goal might be to find the series that maximizes or minimizes values for the greatest number of variables.
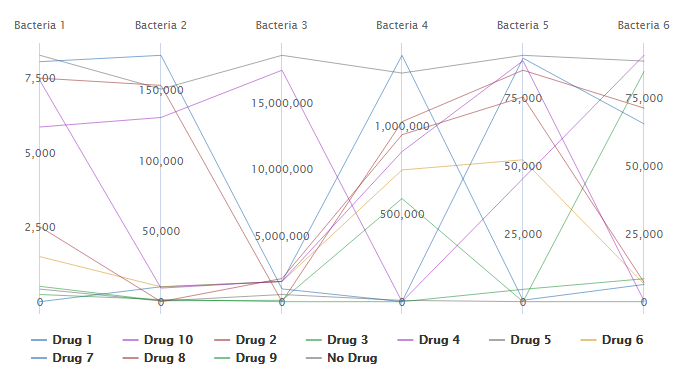
For example, this plot shows the effect that various drugs have on the growth of multiple types of bacteria. The line running along the top of the plot shows the growth of each bacteria with No Drug. Drug 1 has a low value of growth for Bacteria 1, 2, 3, 5, and 6. But the growth for Bacteria 4 is actually higher for Drug 1 than for No Drug. Drug 5 and Drug 9 have the lowest amount of growth across all 6 types of bacteria. The researcher decides to focus on these two drugs for more detailed experiments.
Note
You can hold your cursor over a series for more detailed information.